Lectures 4-6: Hot spots and seamounts
- Early ideas:
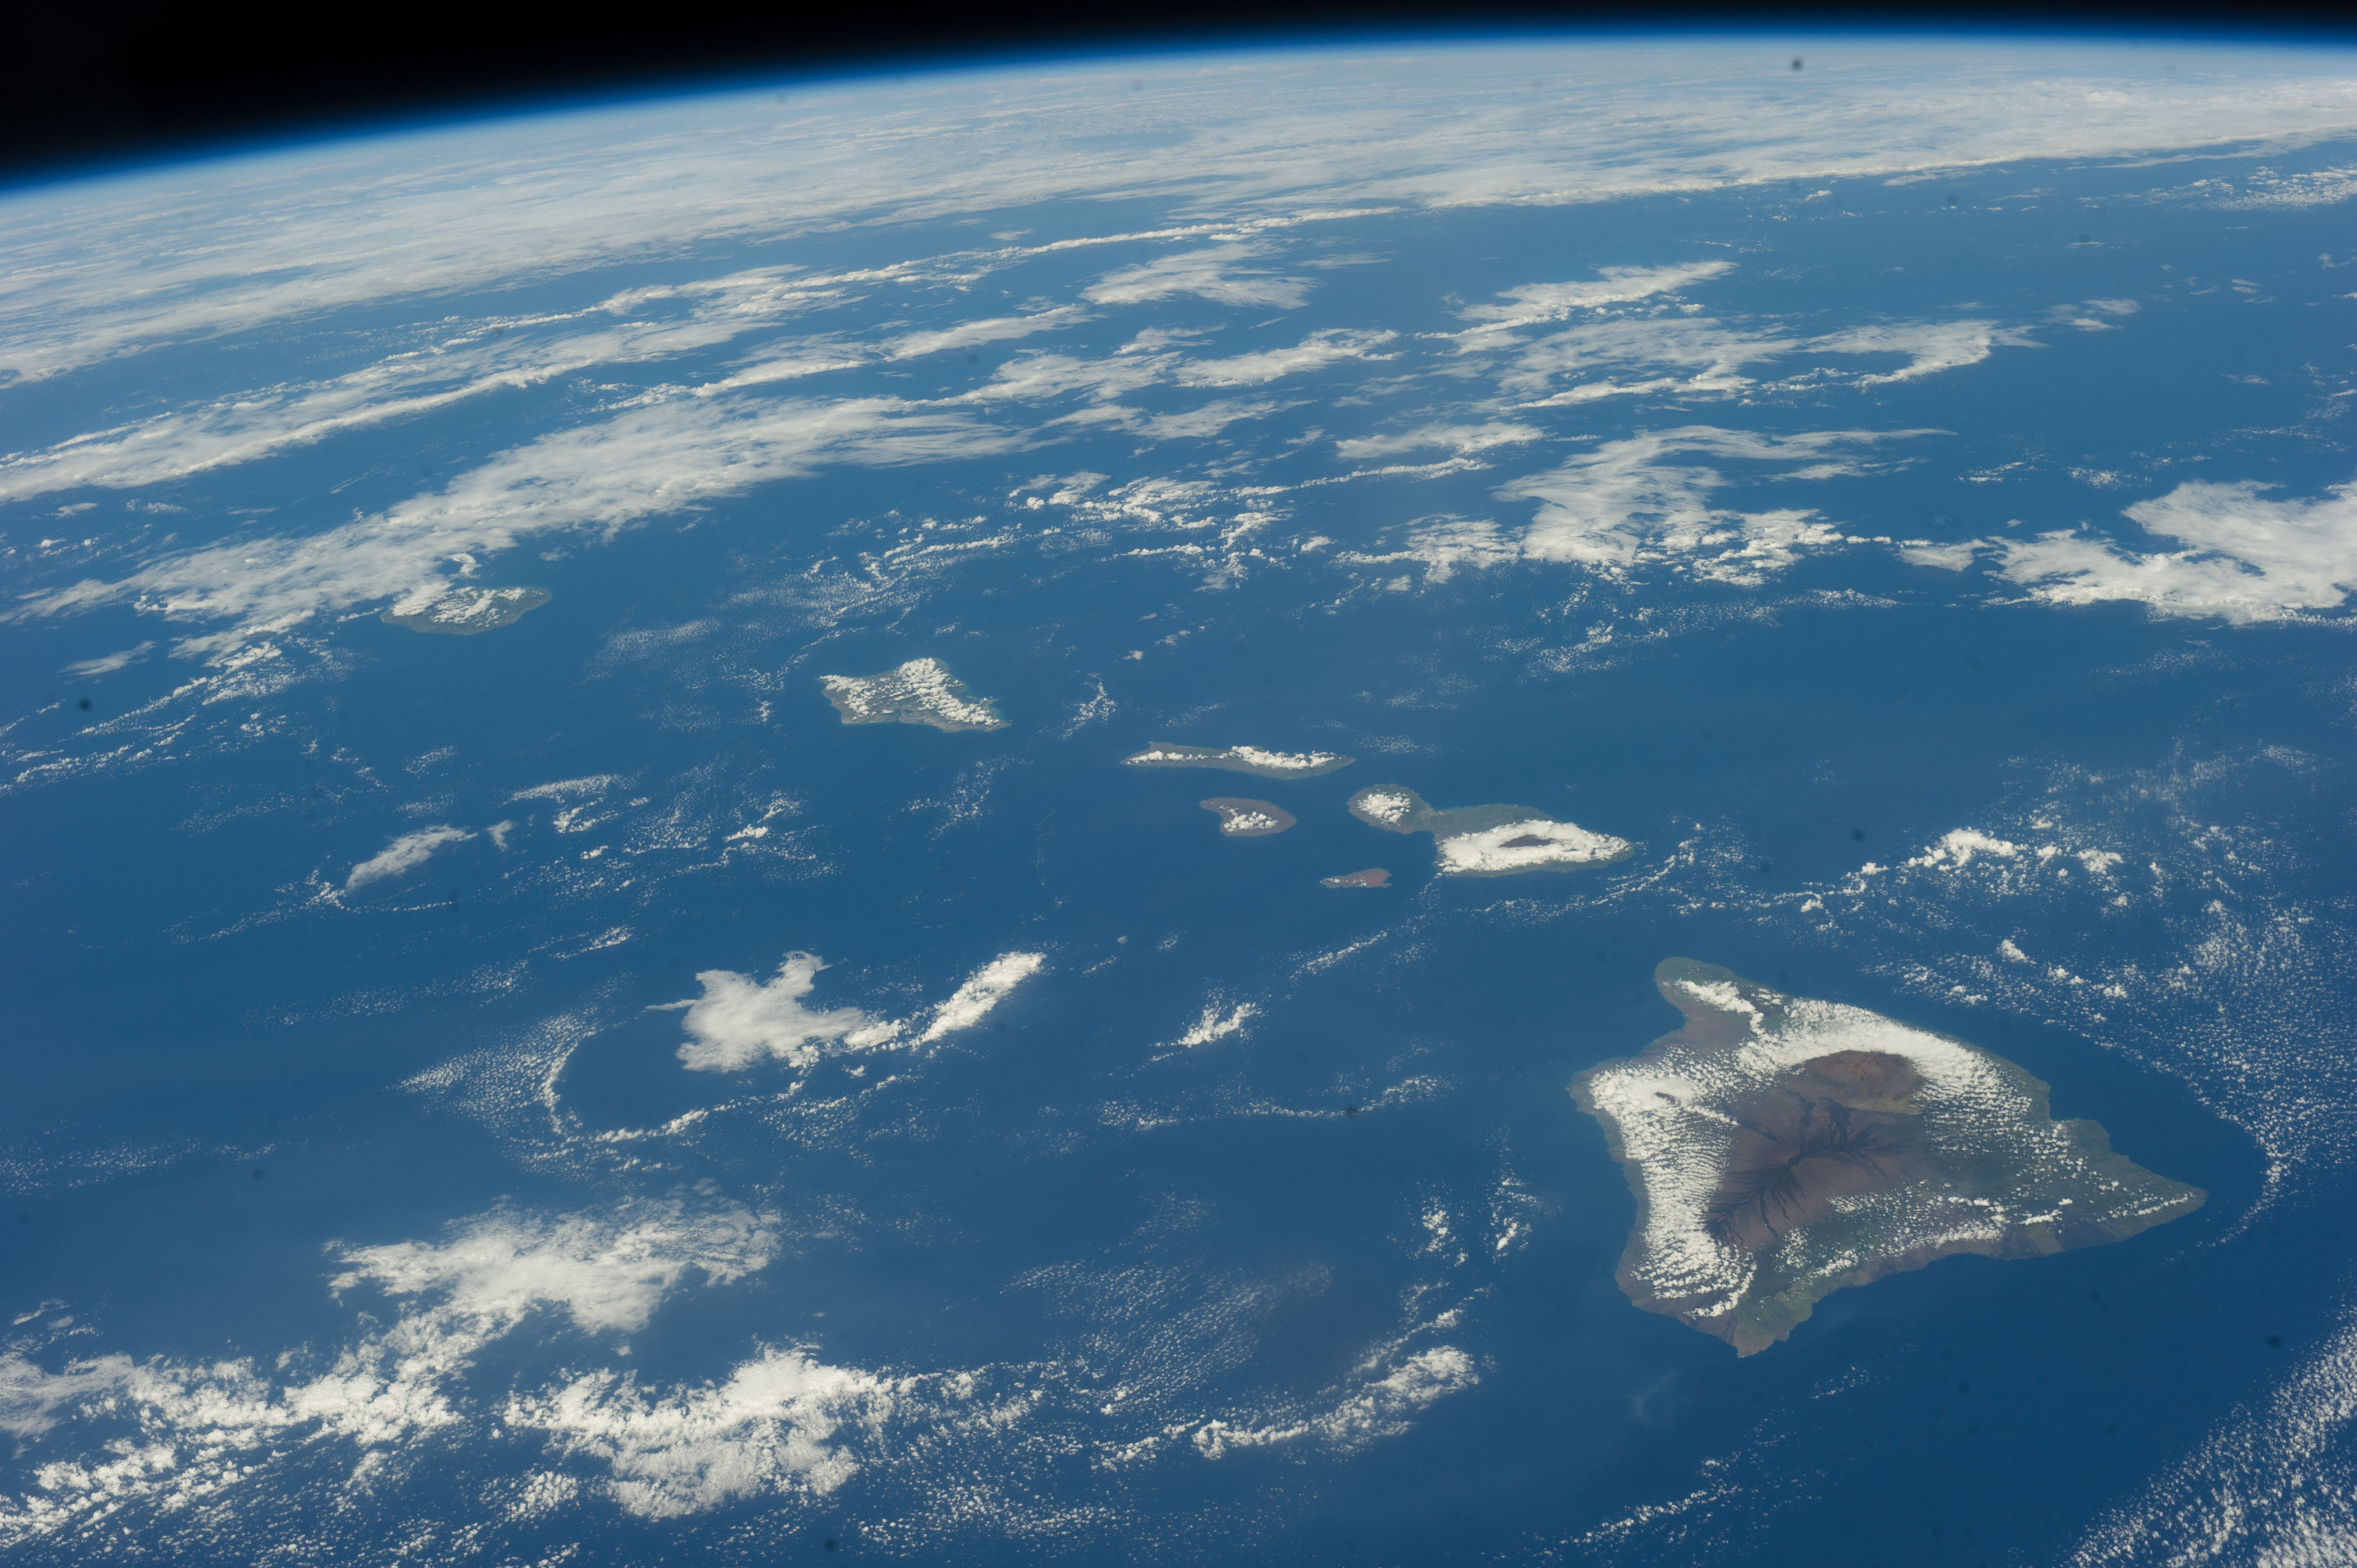
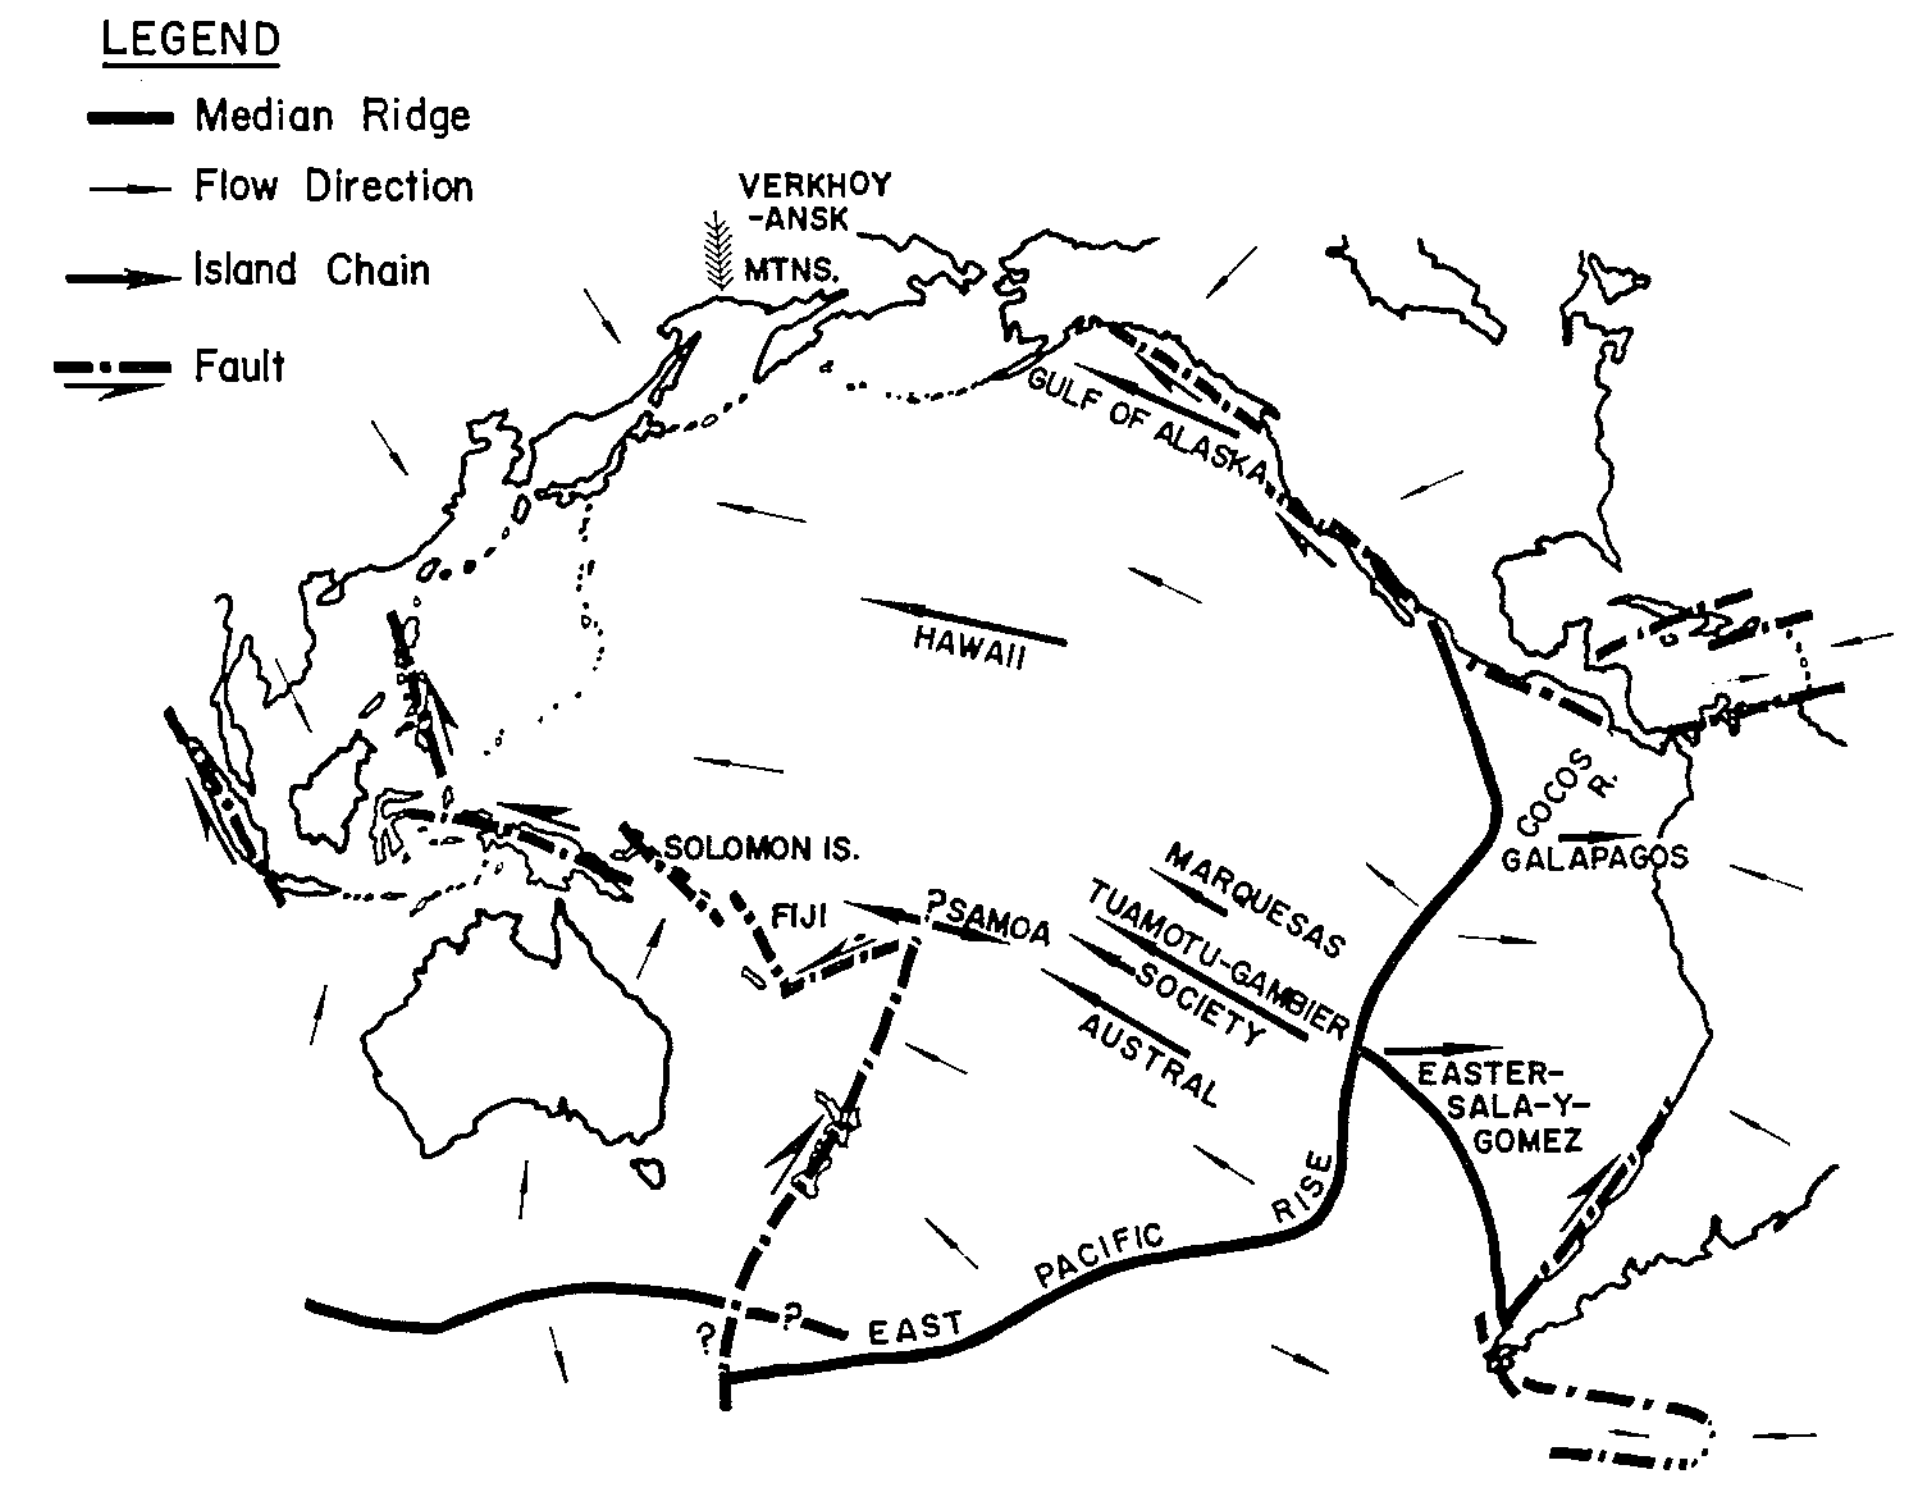
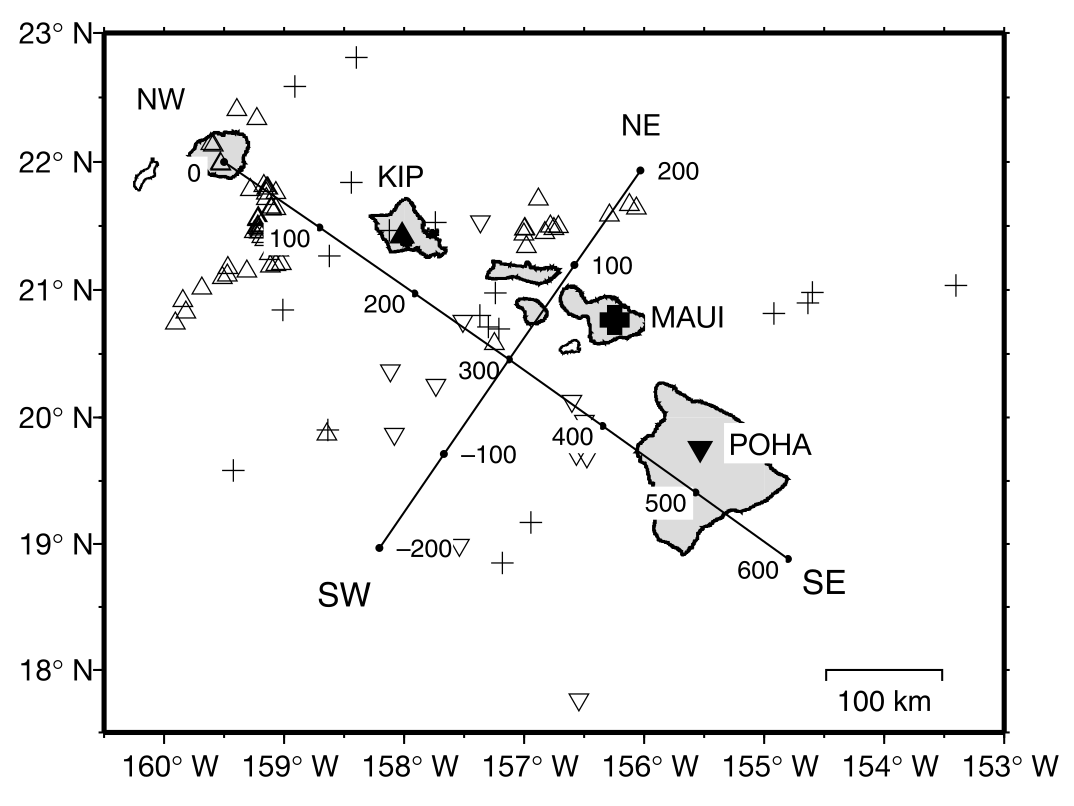
- Origin of the Hawaiian Islands
- Convective models of the mantle
- Swells and depth anomalies
- Geochemistry weighs in:
- Seafloor Basalt Geochemistry and Potential Temperature
- Compatibility and decay systems
- The fate of slabs
- Large igneous Provinces and Plumes
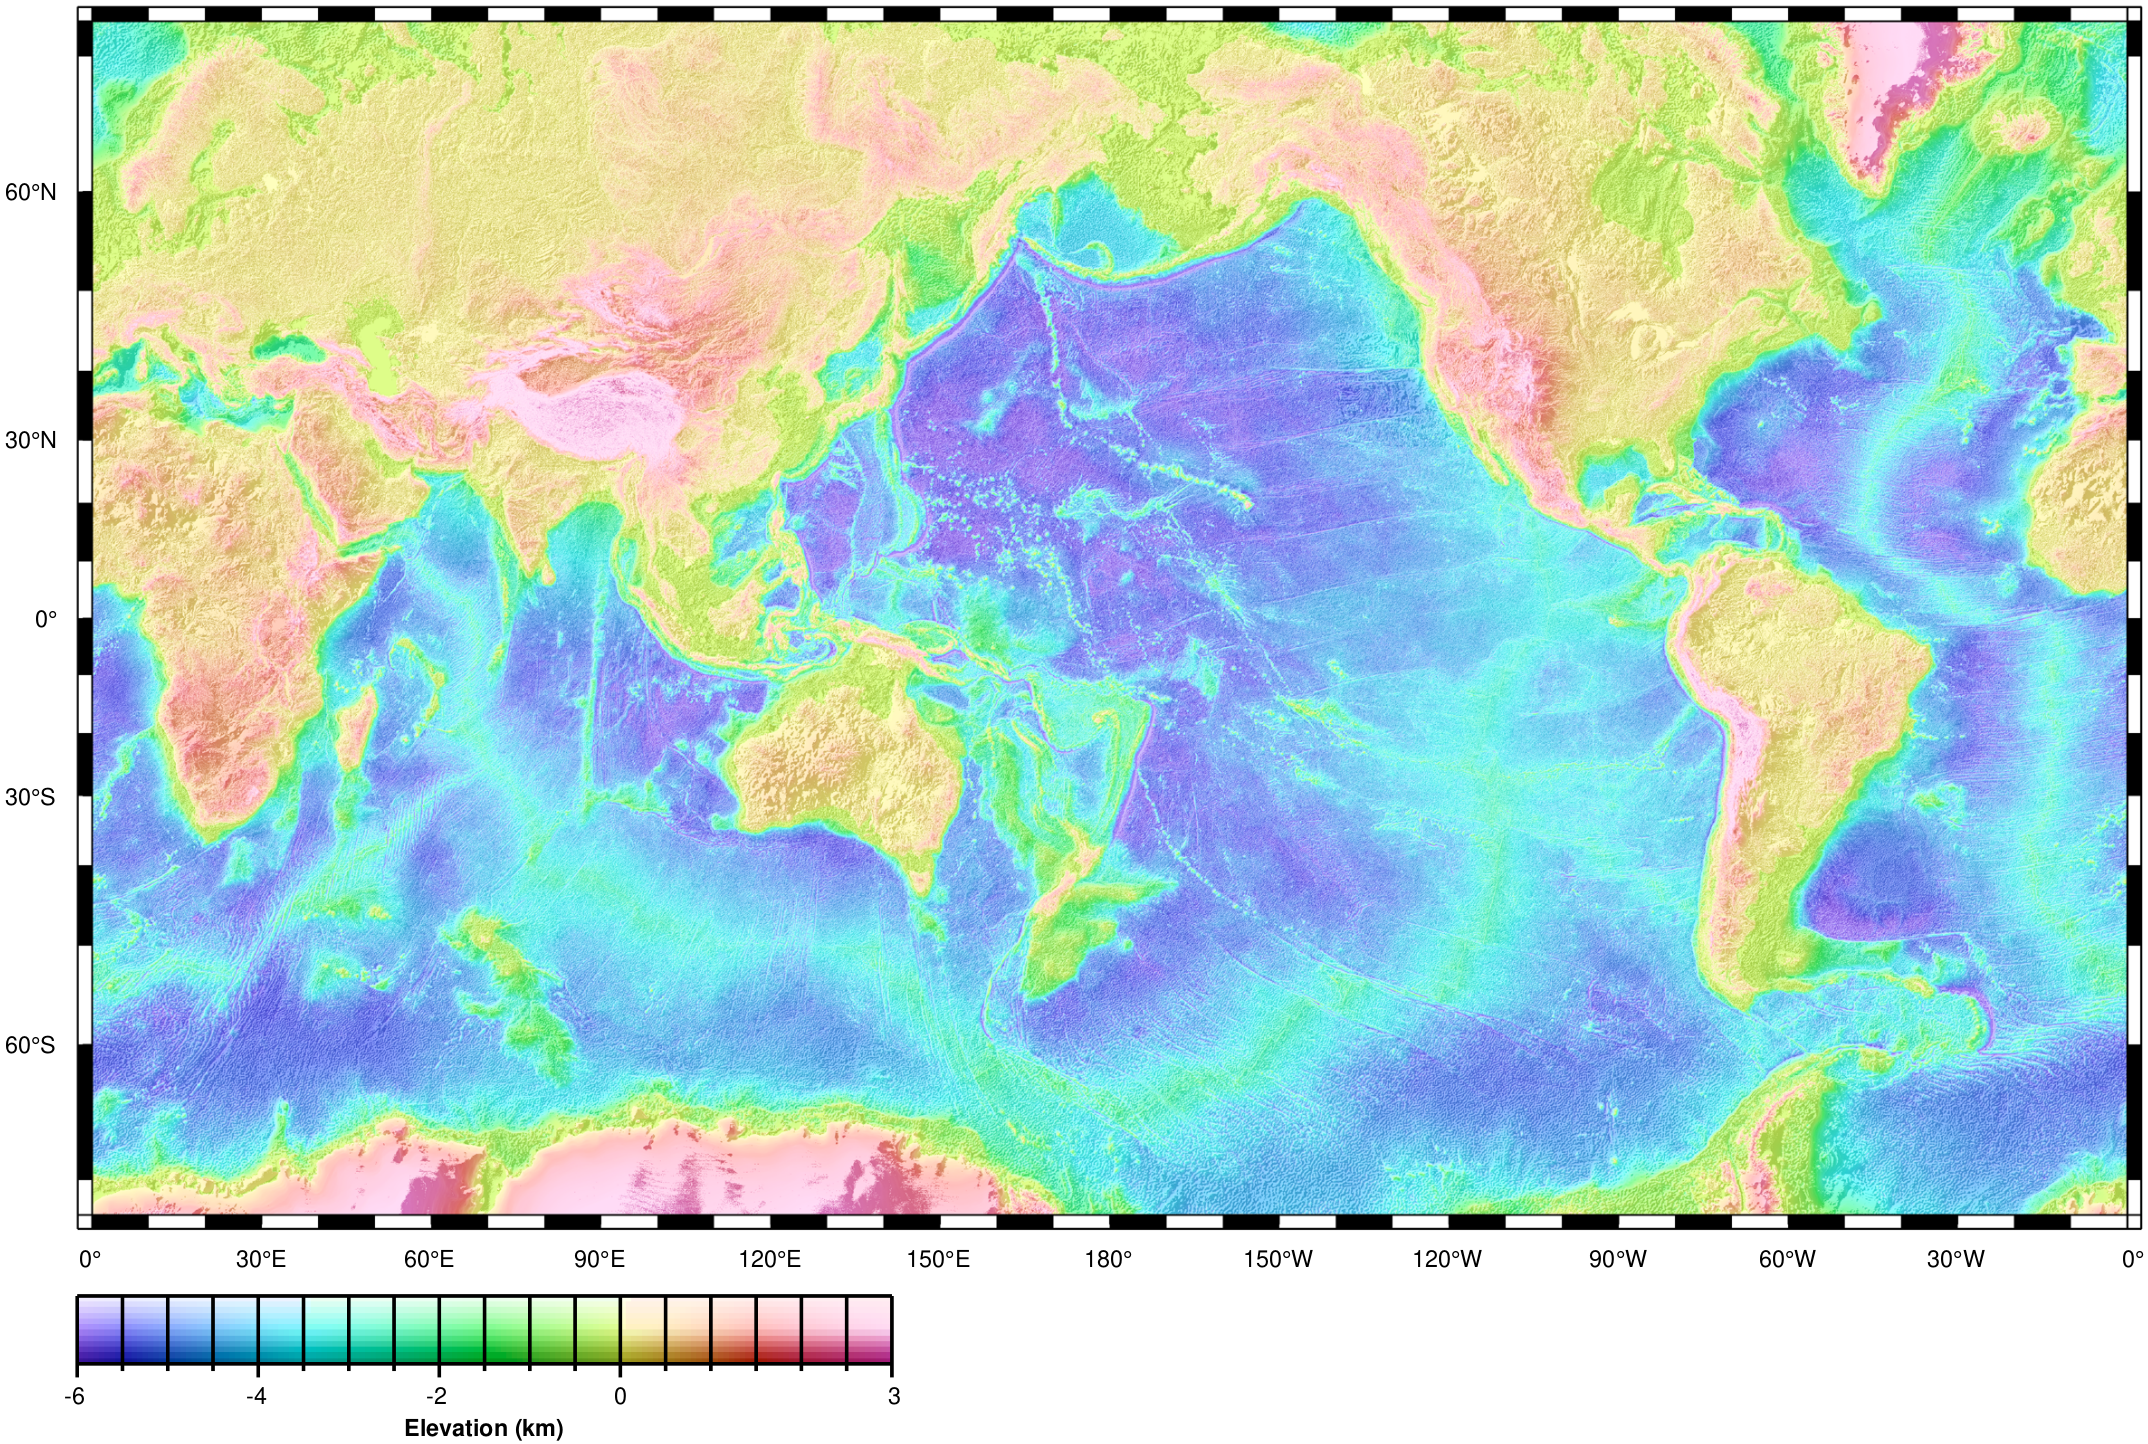
Features of the seafloor
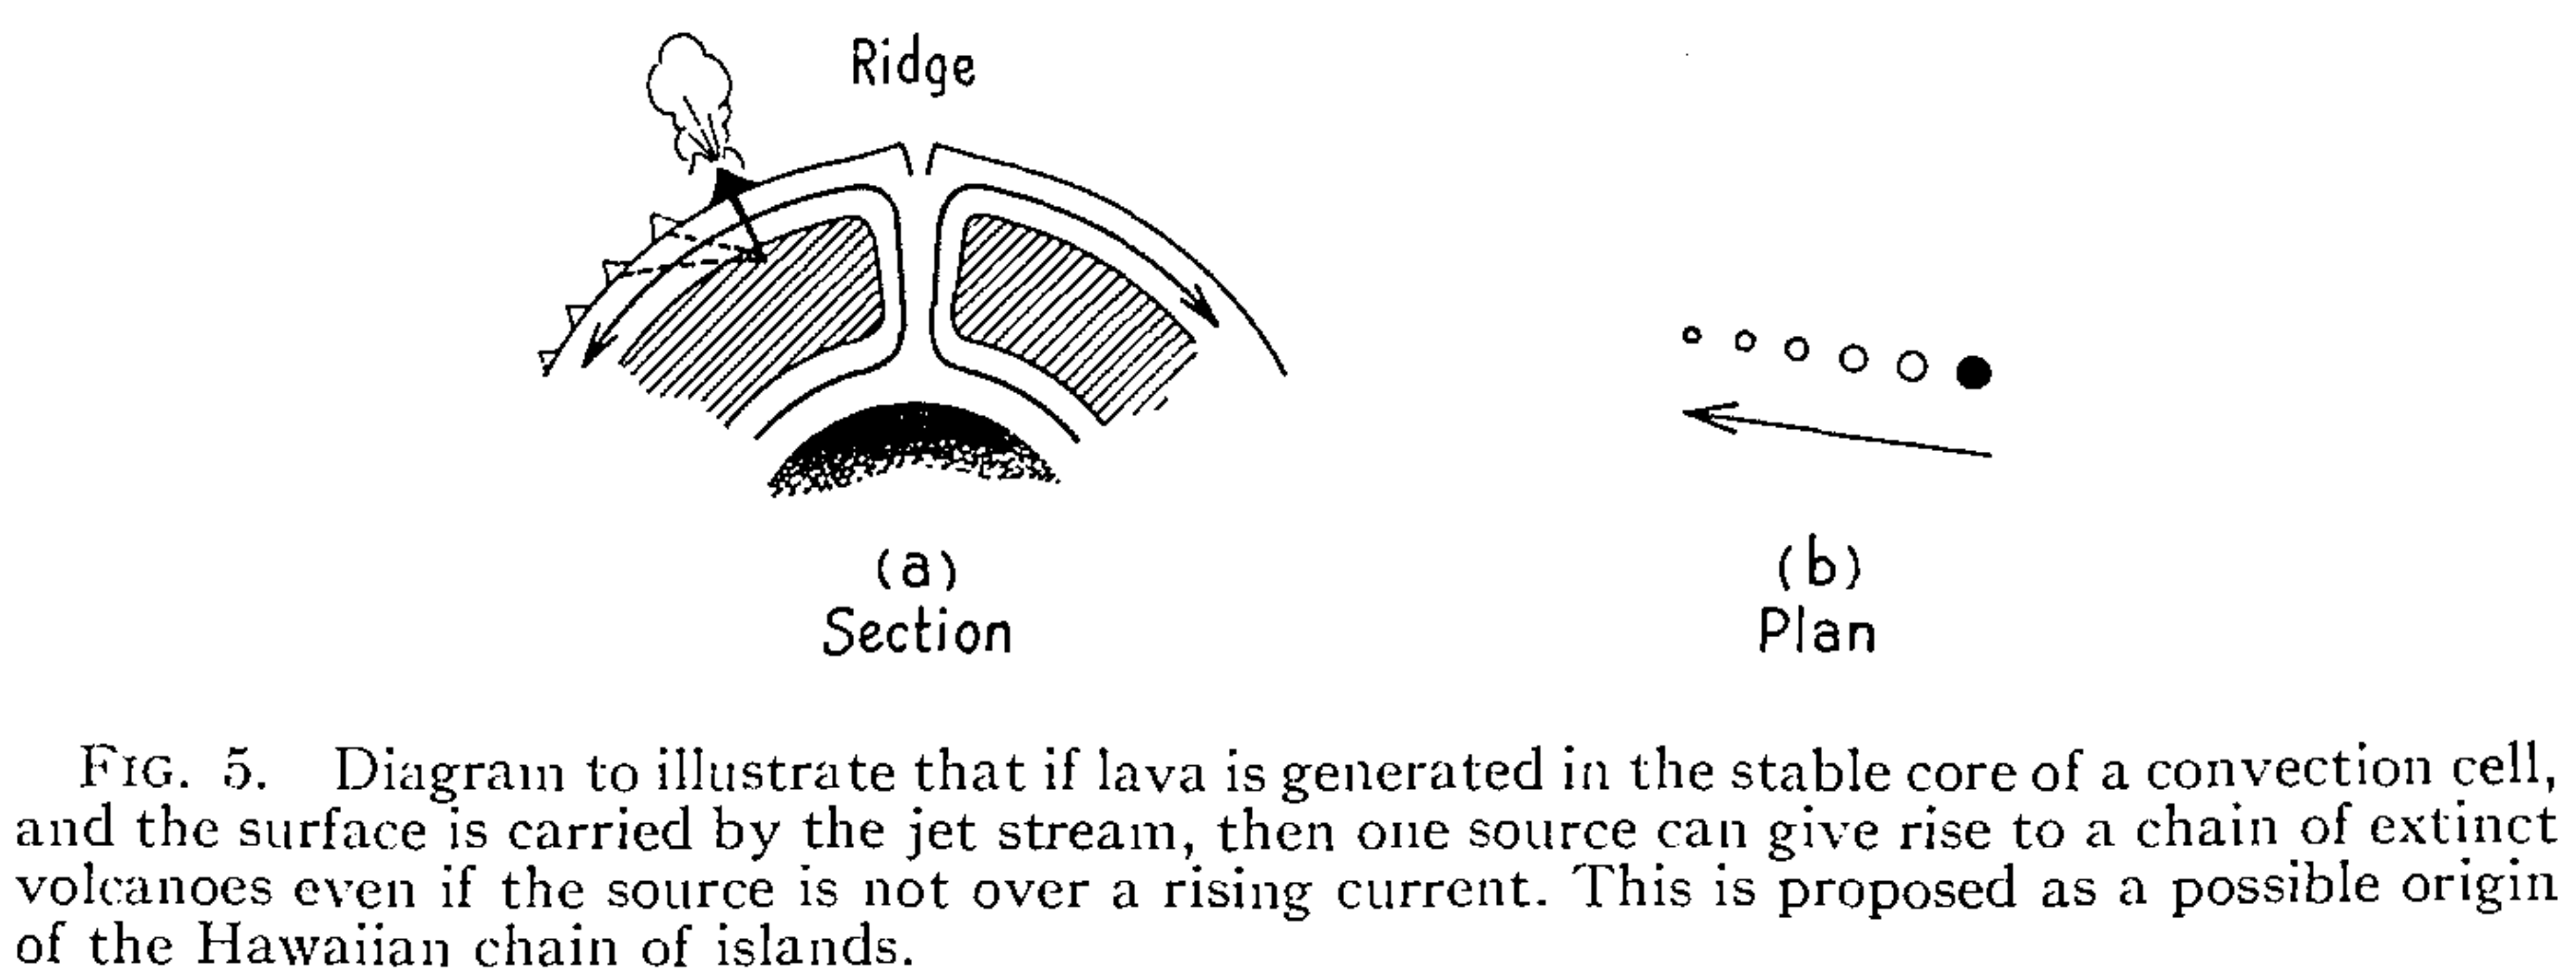
A possible origin of the Hawaiian Islands (Tuzo Wilson, 1963)
Possible convective models
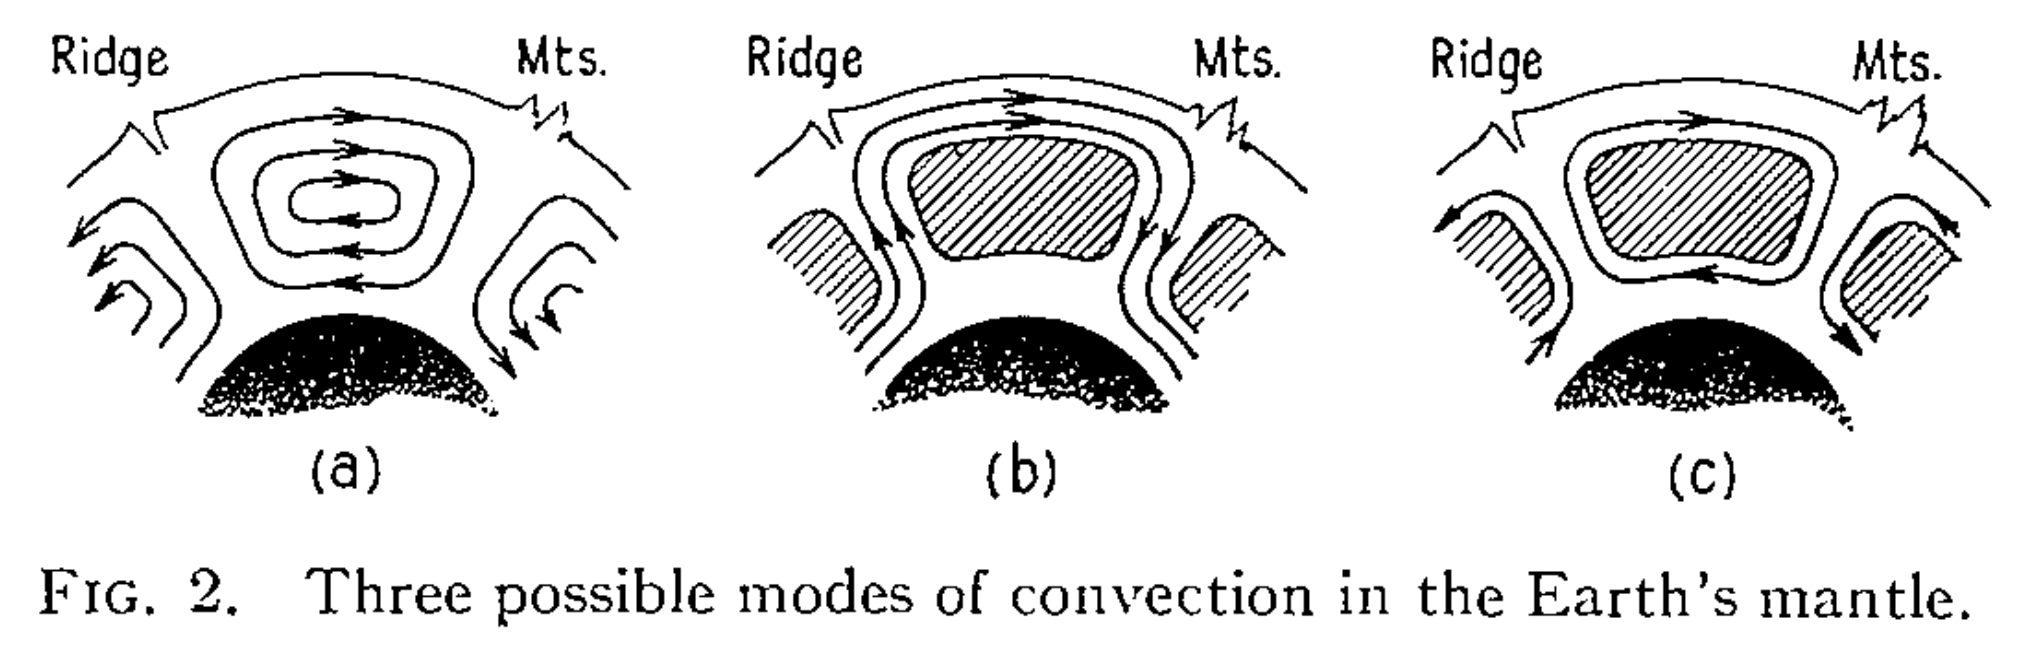
The volcanic consequences of each convective model
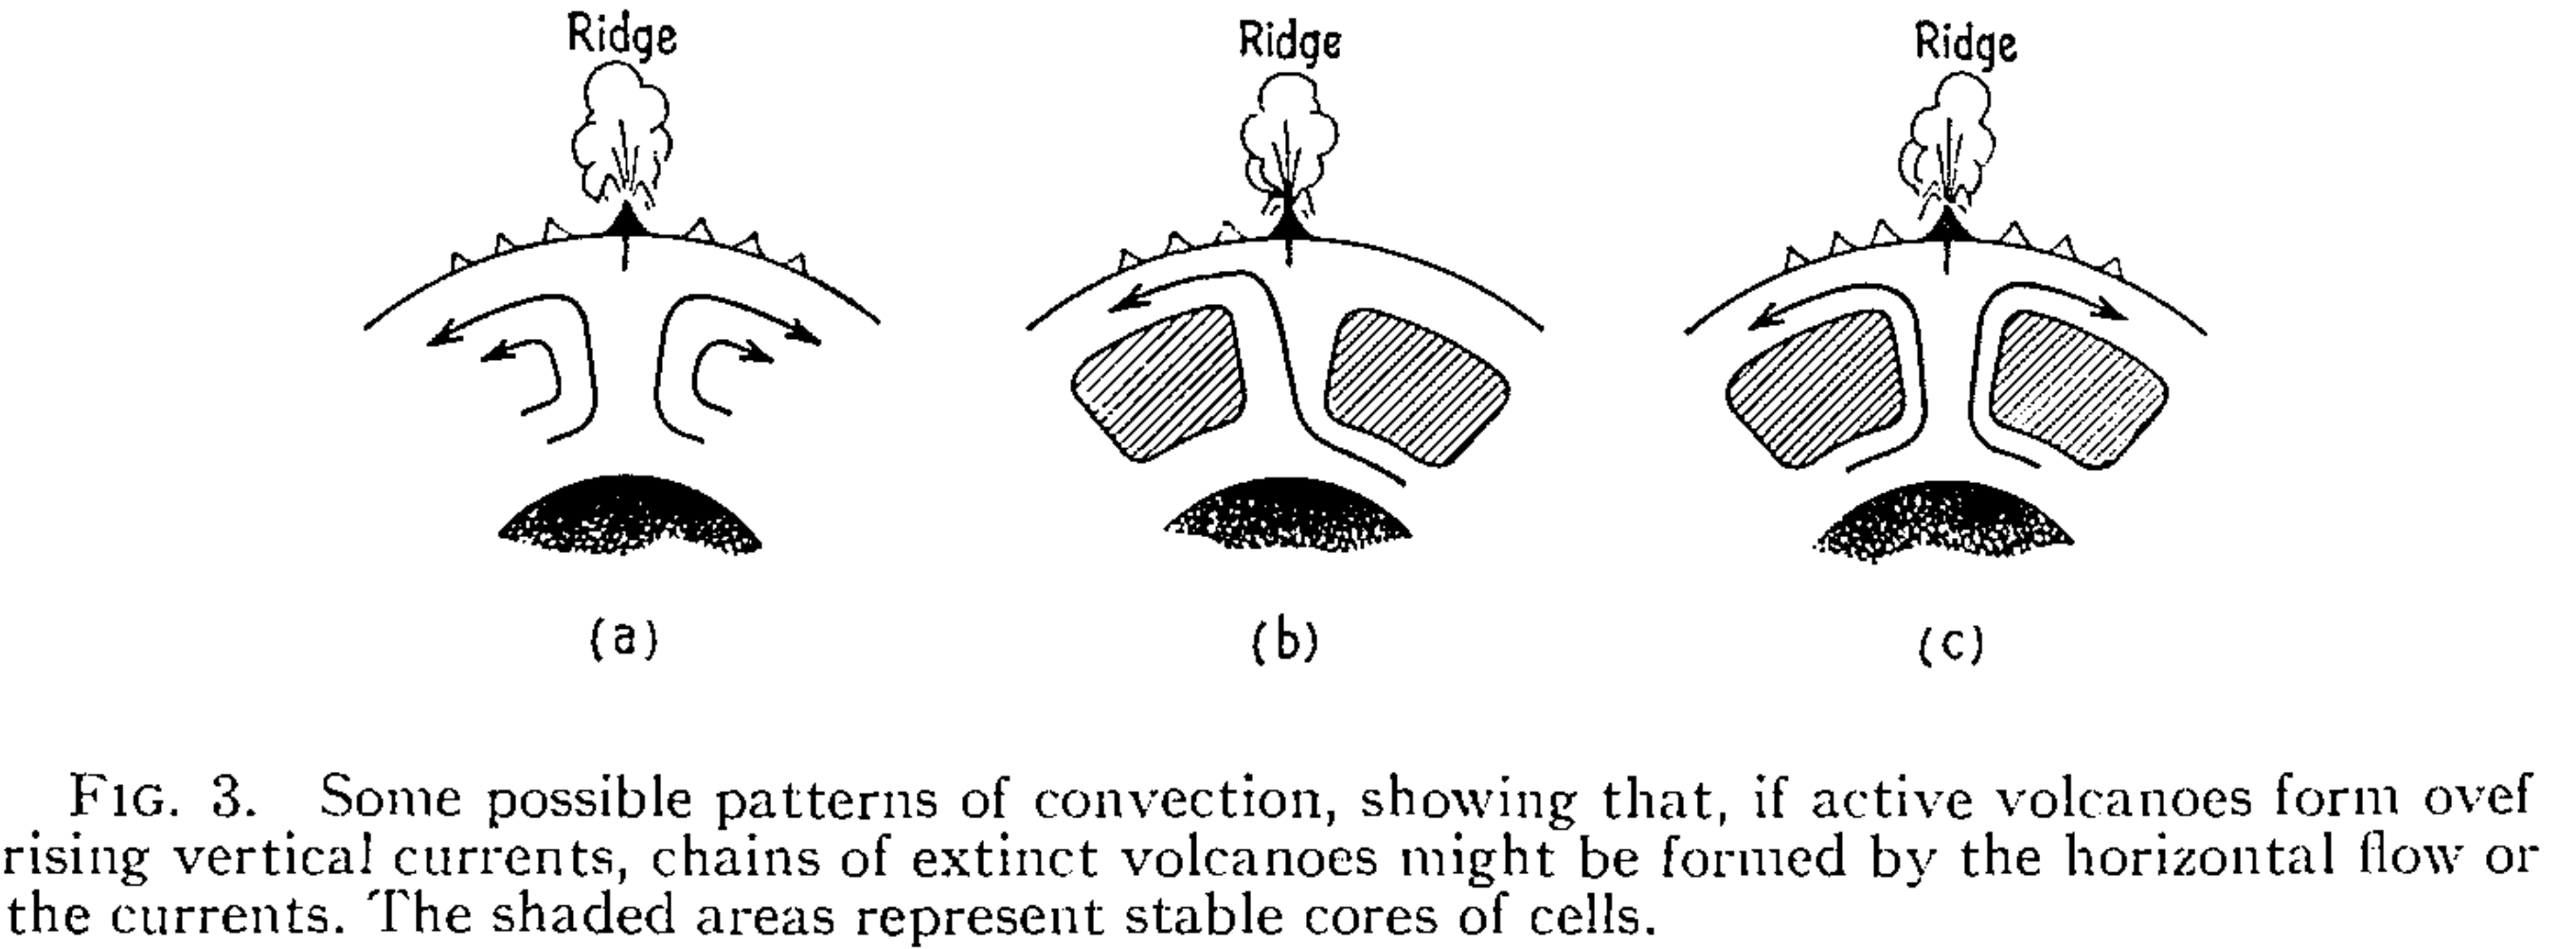
The volcanic consequences of each convective model
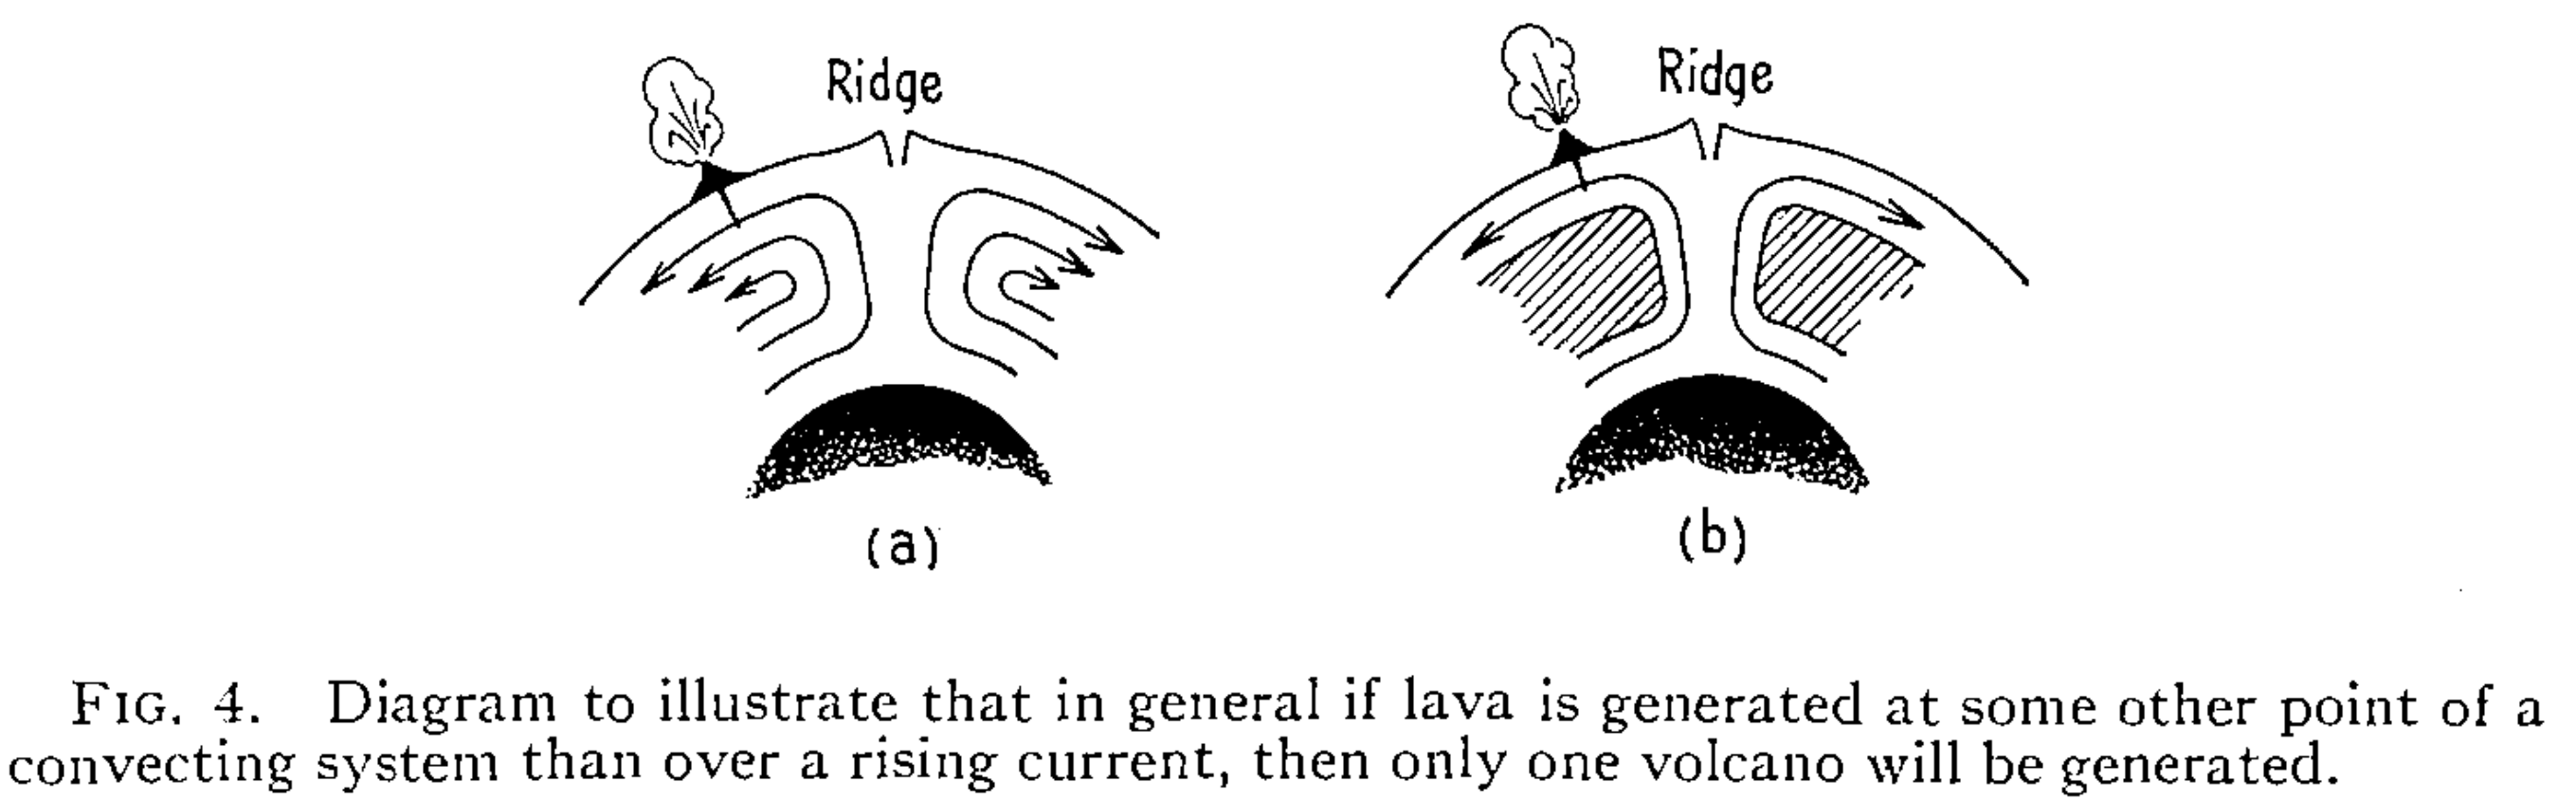
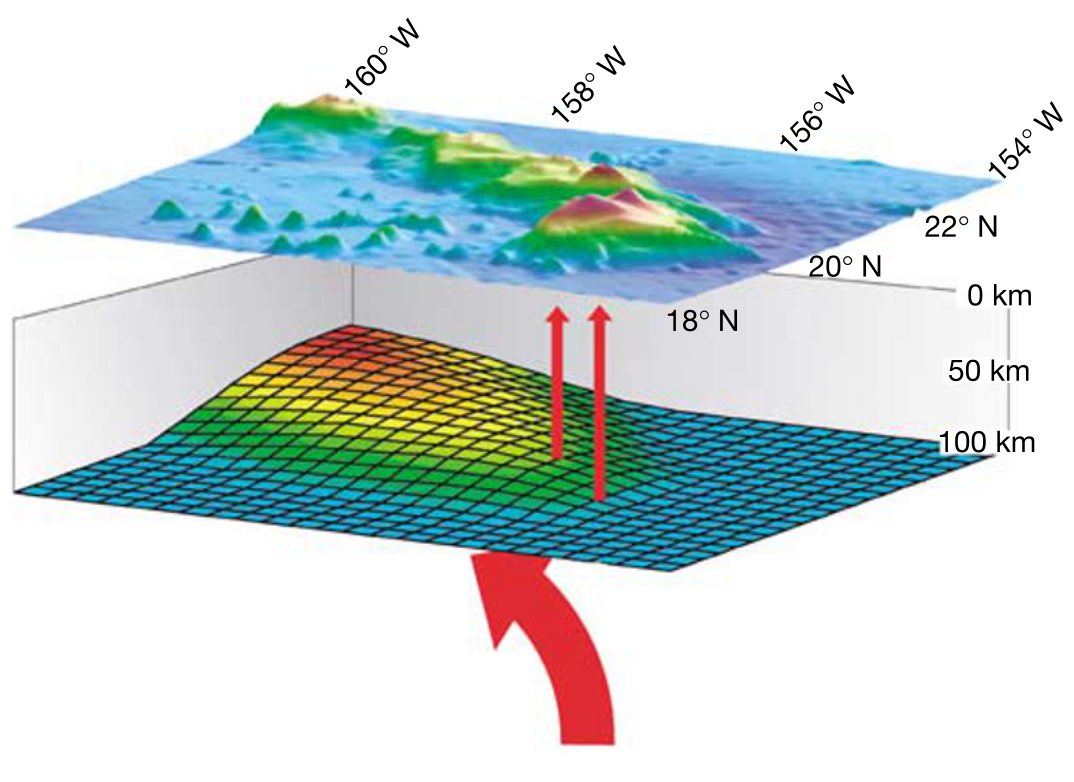
The source of lavas must be deep
The plume
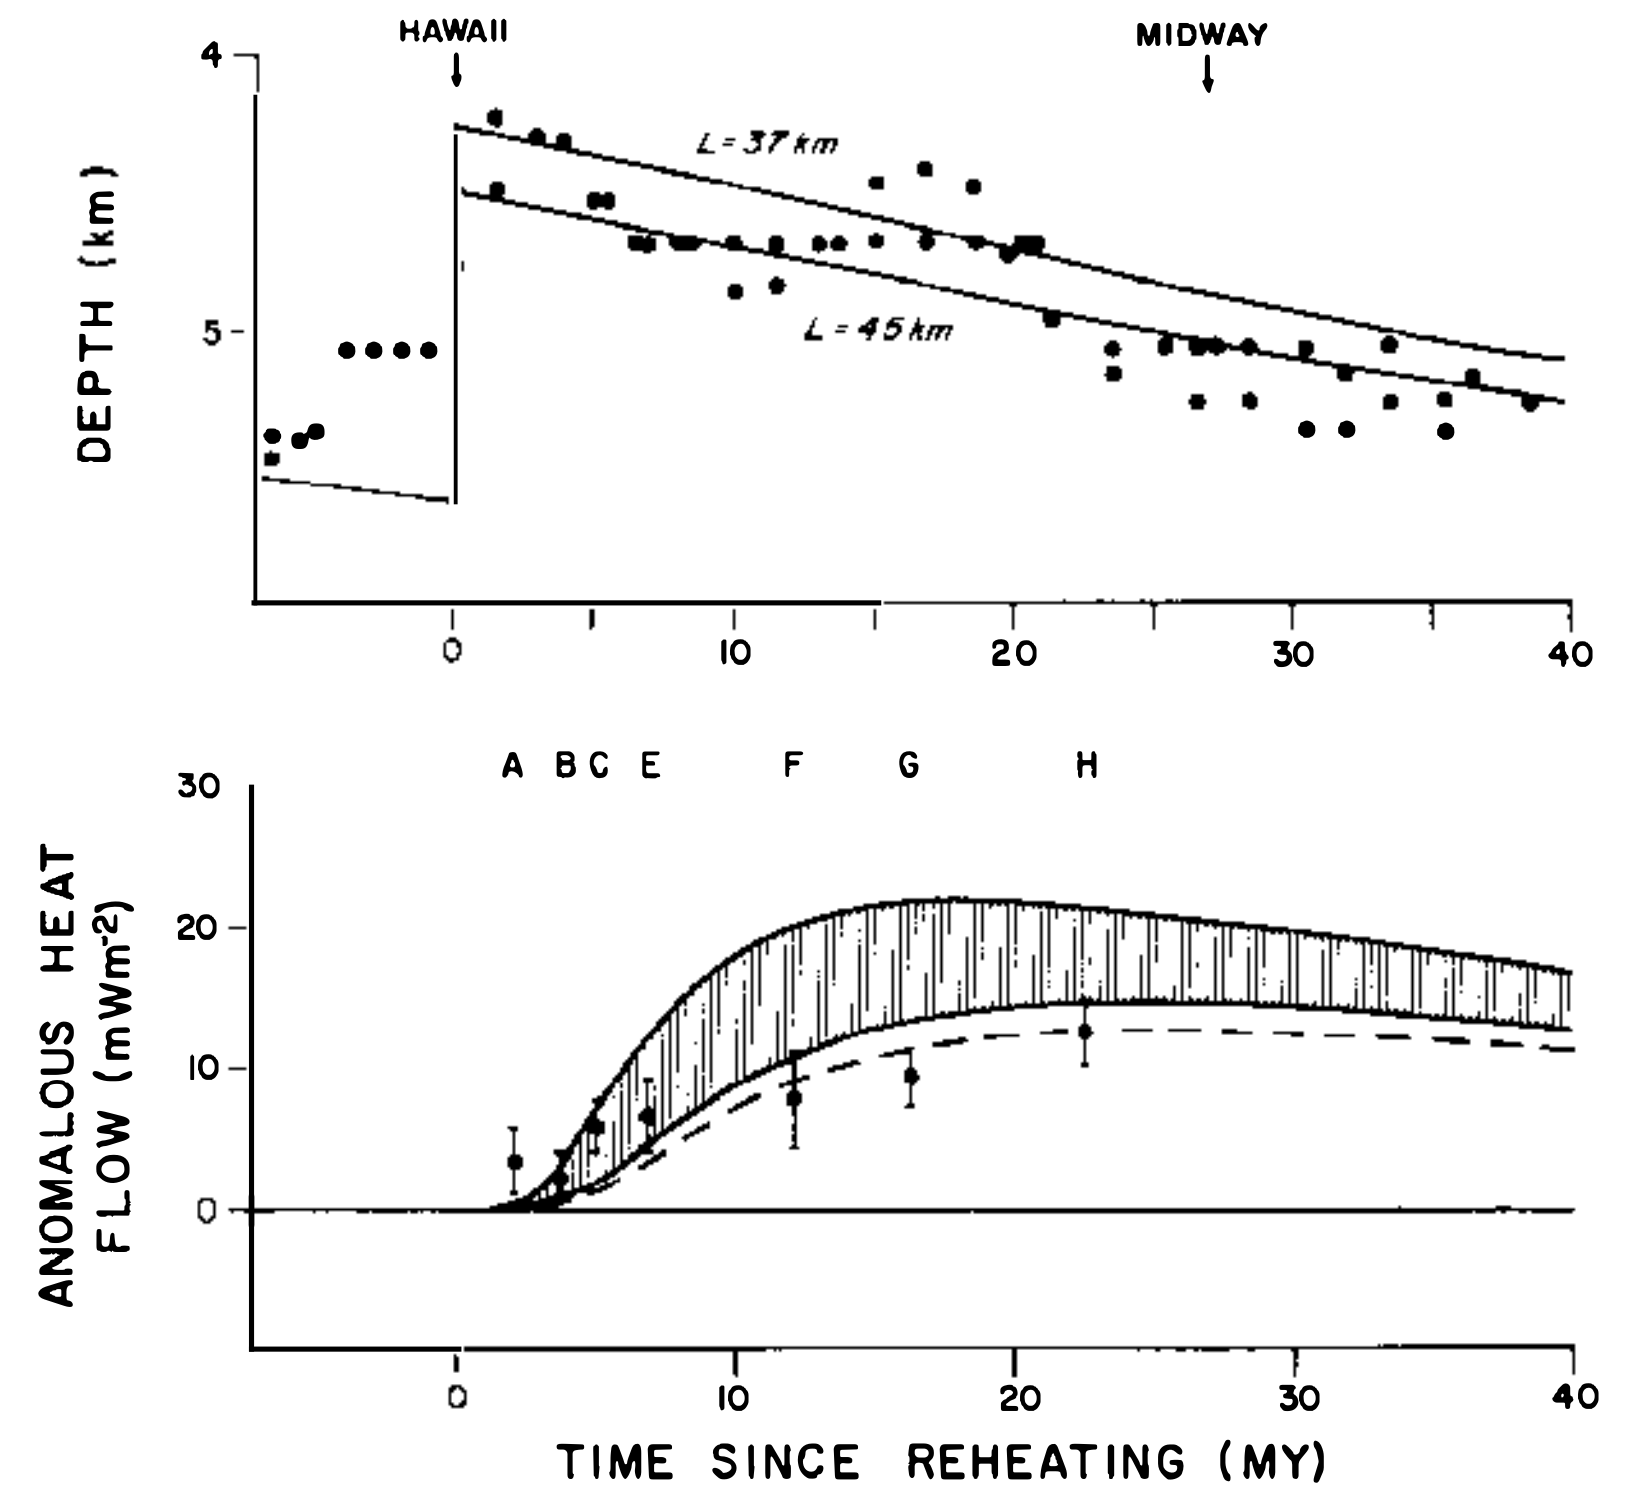
Swells and depth anomalies
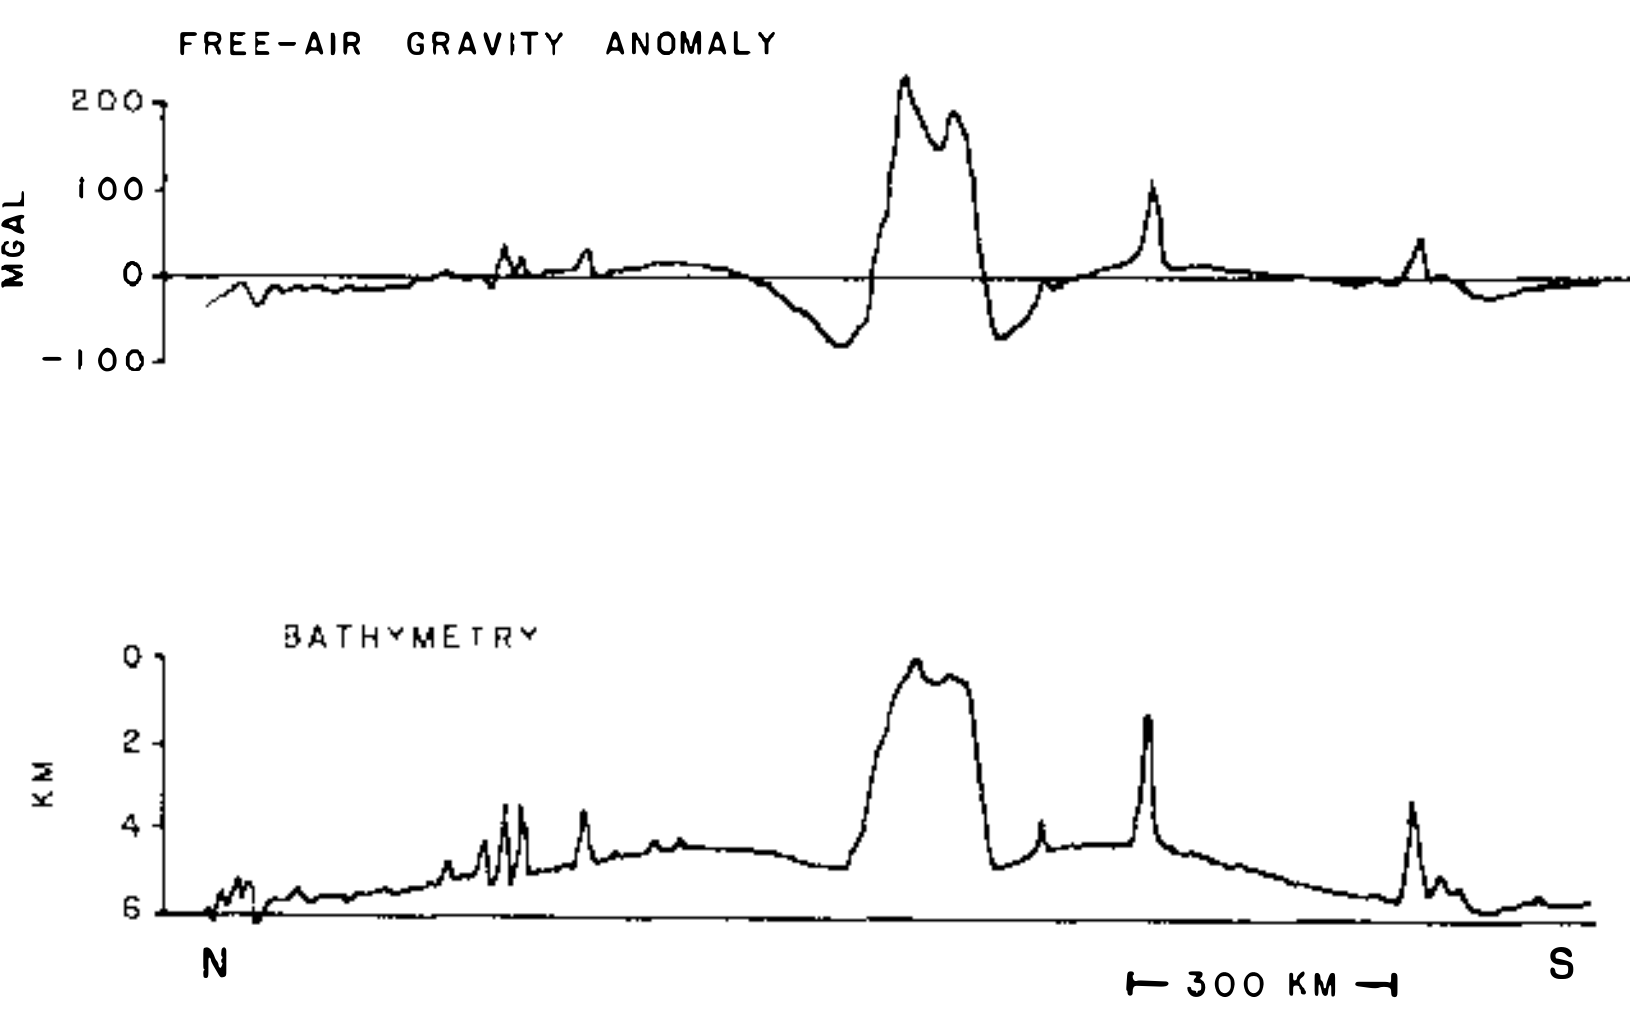
Supporting swells
Supporting swells
Are ridges passive or active?
- Ridges move with respect to a reference frame (what reference frame??)
- What happens when a ridge is offset by a transform fault?
- Challenges posed by these questions are solved if the ridge system is the result of spreading plates
- Melting is a passive process driven by spreading, not driven by hot sheets of rising mantle
Potential temperatures
In our daily lives we have an intuitive understanding that a hot object generally has more heat content (enthalpy) than the same object after it cools. This intuition is less useful when considering materials on Earth (rocks, air, water) that are moving quickly across pressure gradients.
The first law of thermodynamics can be stated as:
\begin{equation} \begin{gathered} & dQ & = &~dU~& + &~PdV & \\ & change~in~heat~ & = & ~change~in~internal~energy~& + &~work~done~on~the~environment & \end{gathered} \end{equation}where $dV$ is the change in volume, and $P$ is the pressure. When considering adiabatic processes, where there is no change in heat, $dQ=0$, we find that the temperature of a material changes due to work done by the system.
\begin{equation} \begin{gathered} & dQ & = &~dU~& + &~PdV & \\ & 0 & = &~C_vdT~& + &~PdV & \\ & & &~C_vdT~& = &~-PdV & \\ \end{gathered} \end{equation}Potential temperatures
\begin{equation} \begin{gathered} & dQ & = &~dU~& + &~PdV & \\ & 0 & = &~C_vdT~& + &~PdV & \\ & & &~C_vdT~& = &~-PdV & \\ \end{gathered} \end{equation}So when the volume change is positive (expansion), dT must be negative (cooling). Alternatively if we considered the case of constant volume, using $PdV = - \frac{VdP}{\gamma}$, then decreases in pressure lead to decreases in temperature ($\gamma$ is a positive ratio of the specific heat for the material at constant pressure and constant volume).
The potential temperature, $T_p$, is the temperature defined at a reference pressure, and it allows us to use our intuition about temperature when considering the energy (heat content) in a parcel of rock, water, or air. Potential temperatures of the mantle control the starting point for melting during adiabatic decompression.
Basalt chemistry tells us about process at depth: example from MORB
- Why would zero-age depth and chemistry correlate?
- Geochemistry review:
- What trends in FeO content of melt do you expect with increasing melt fraction? (think about minerals in peridotite)
- What trends in NaO content of melt do you expect with increasing melt fraction? (sodium behaves like an incompatible trace element)
Axial depth, crustal thickness, and melting
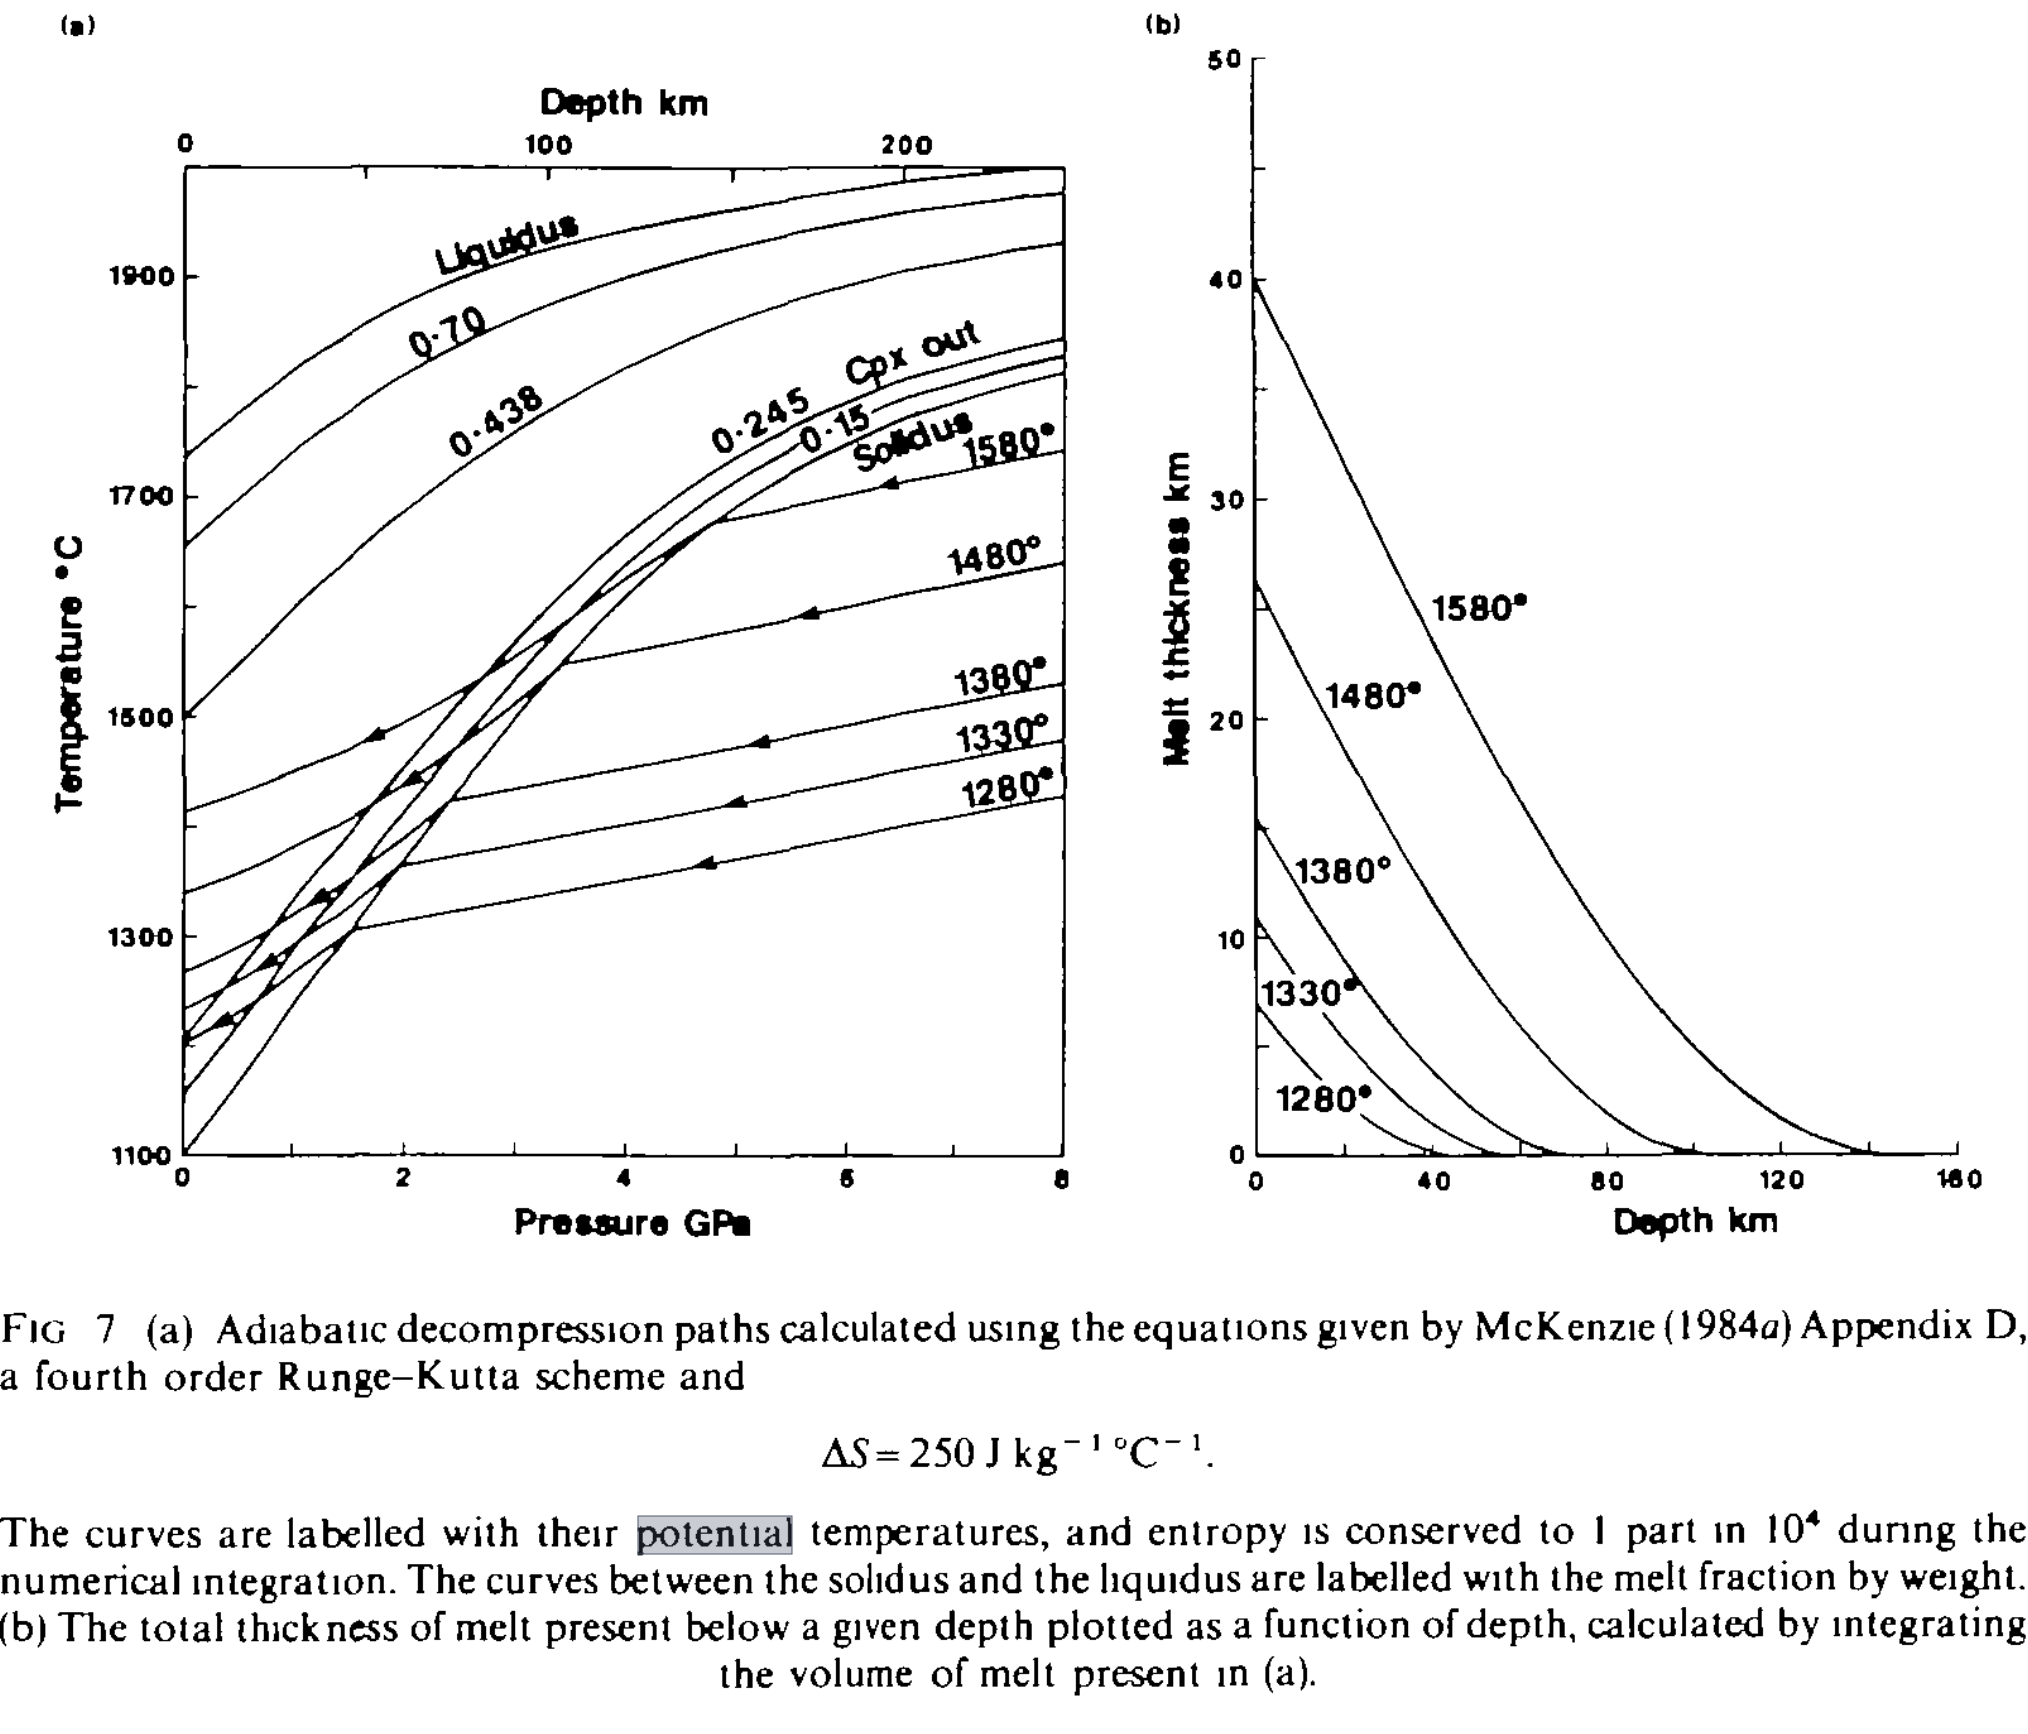
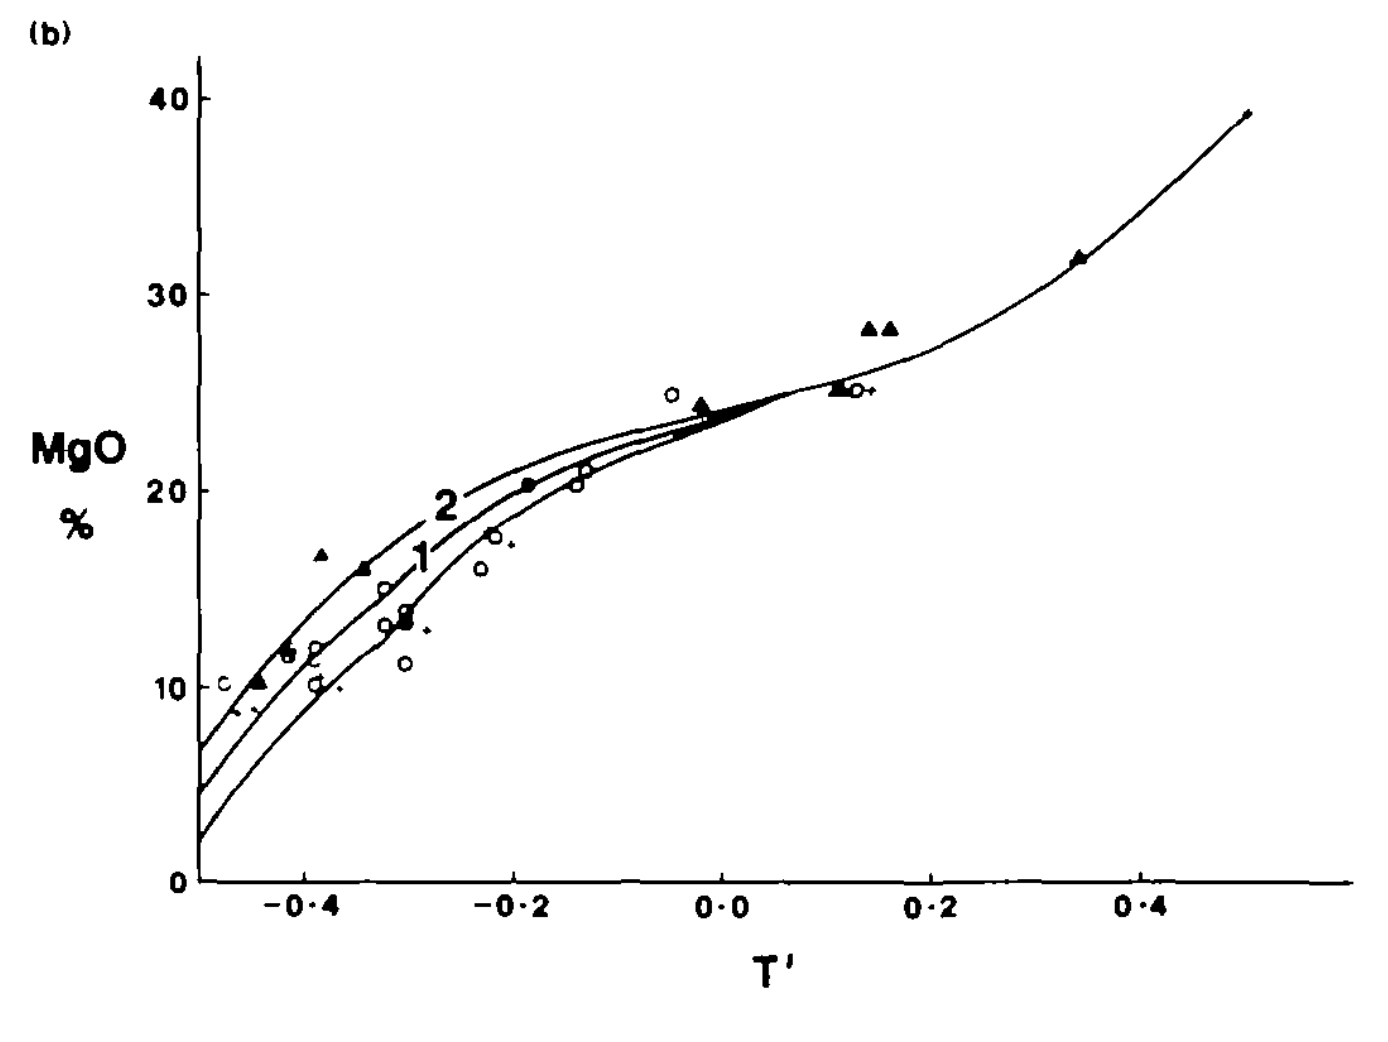
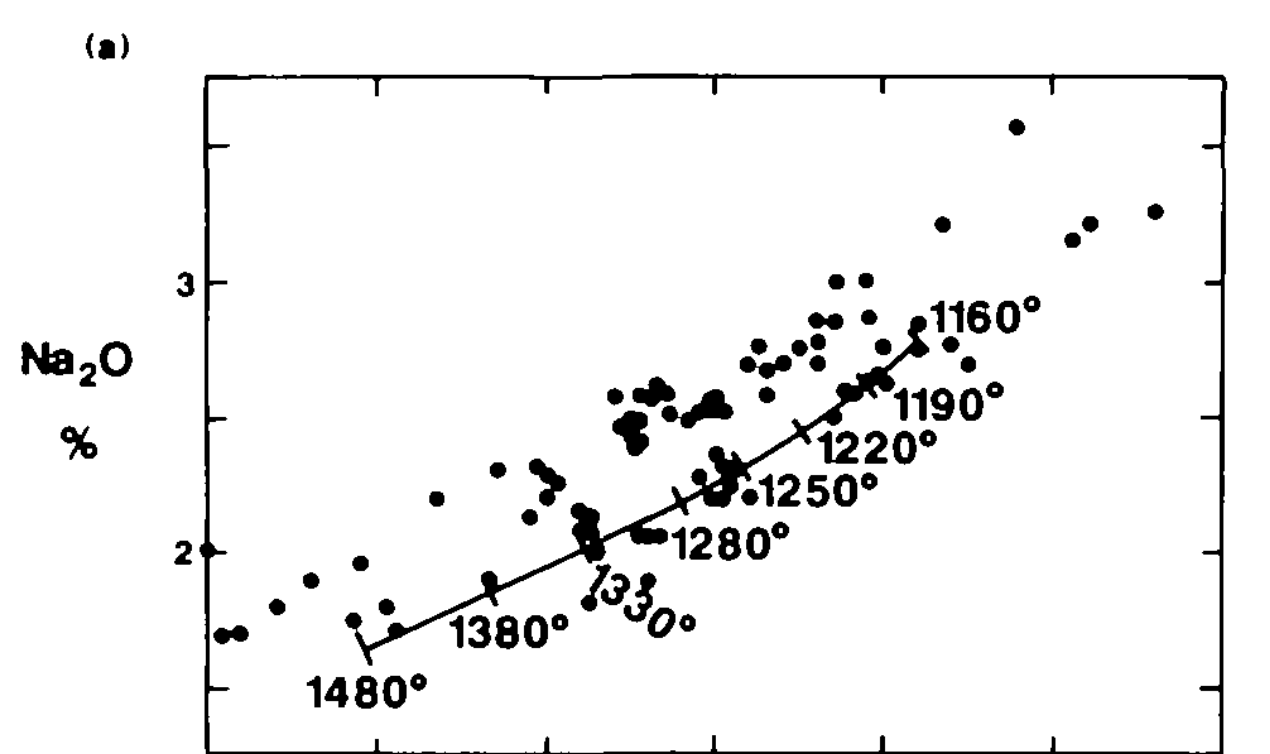
Peridotite melting experiments
Peridotite melting experiments
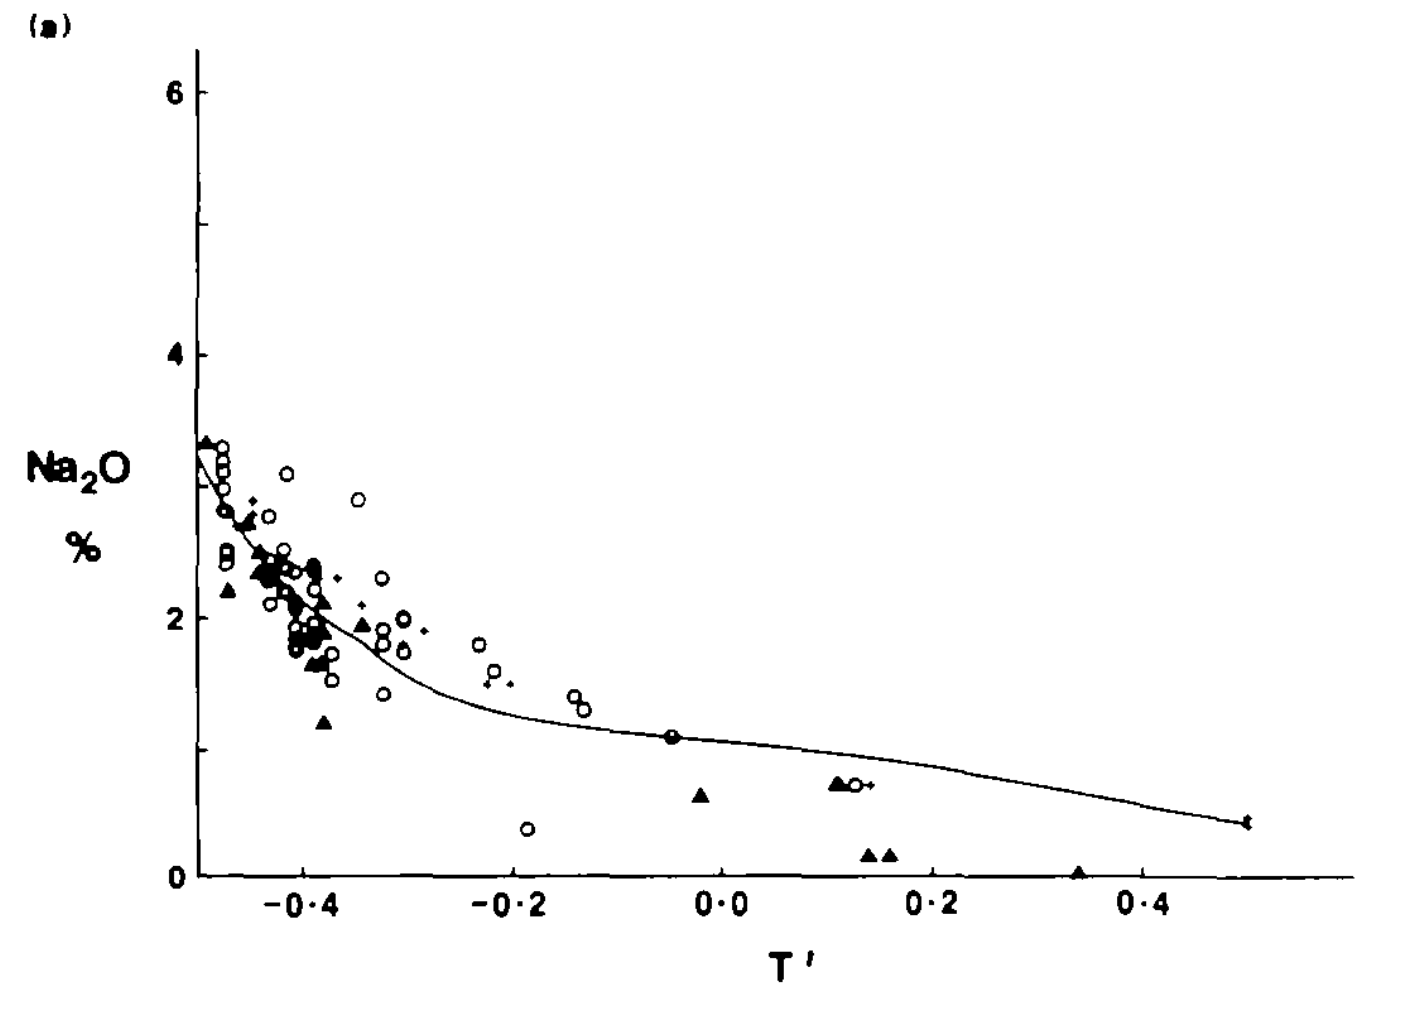
Na2O data from MORB
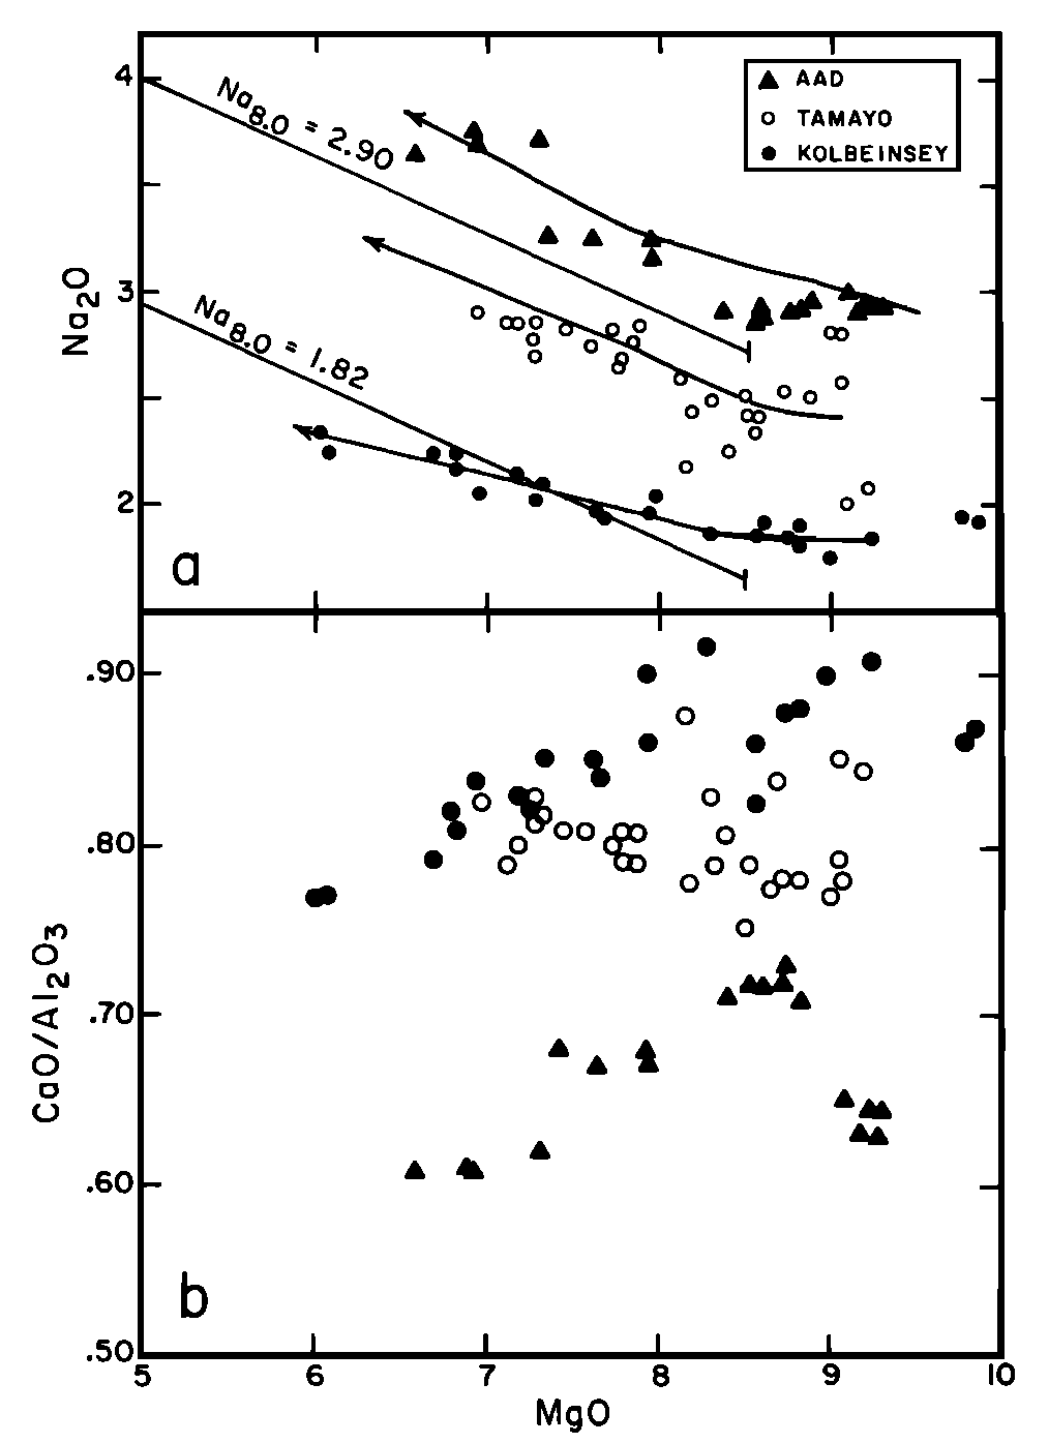
Normalized (MgO = 8%) Na$_2$O
 0 Depth to the ridge axis (km) 6
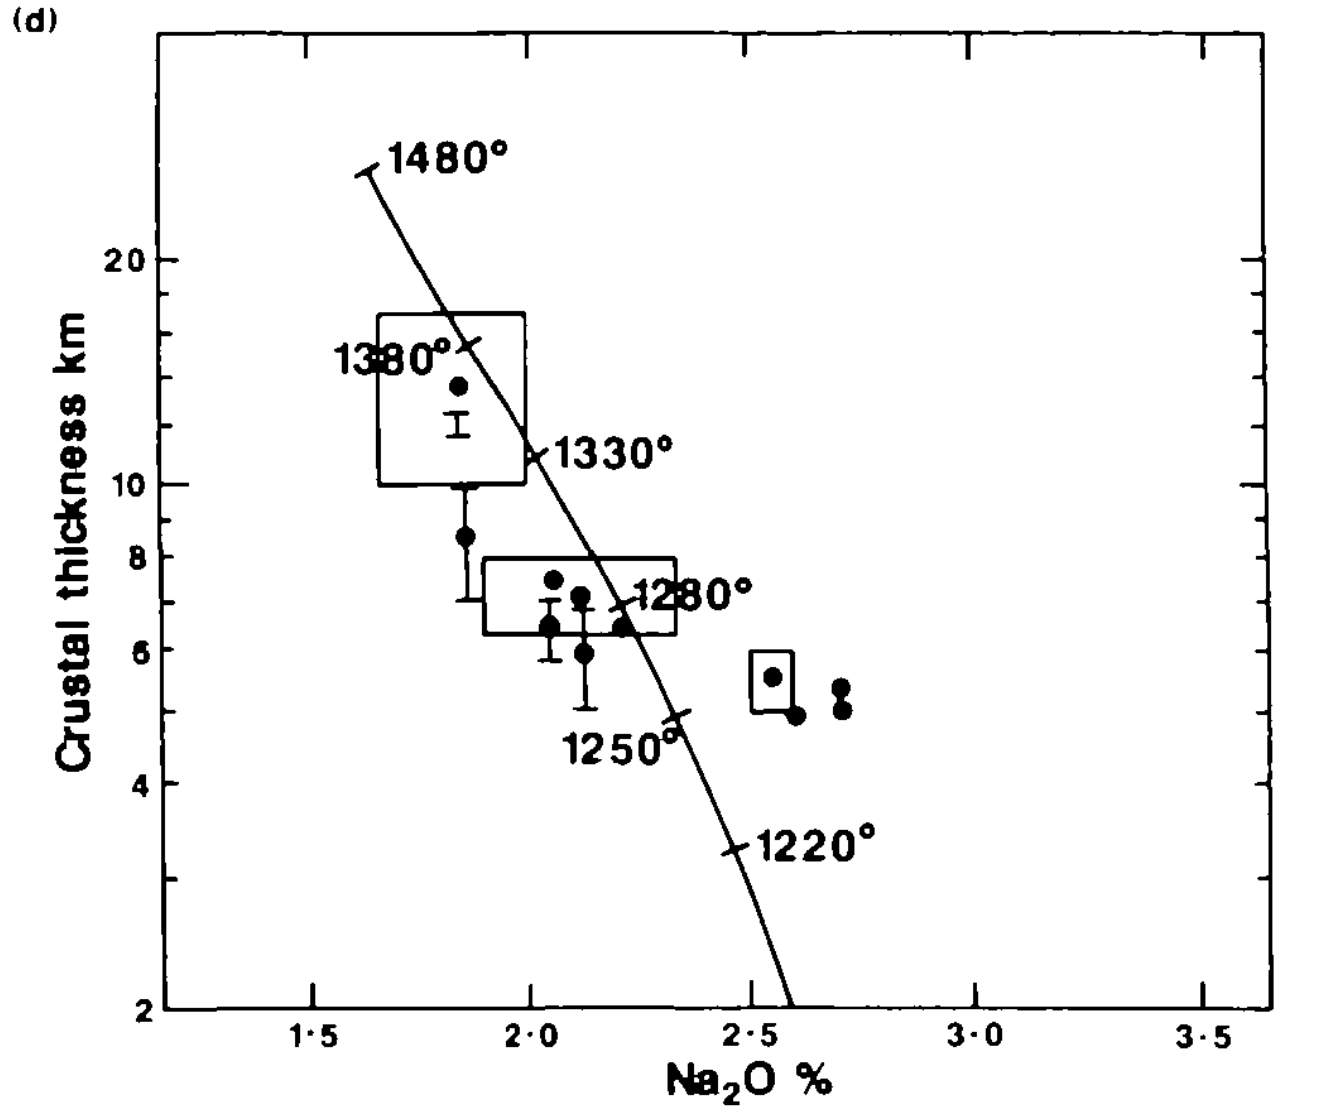
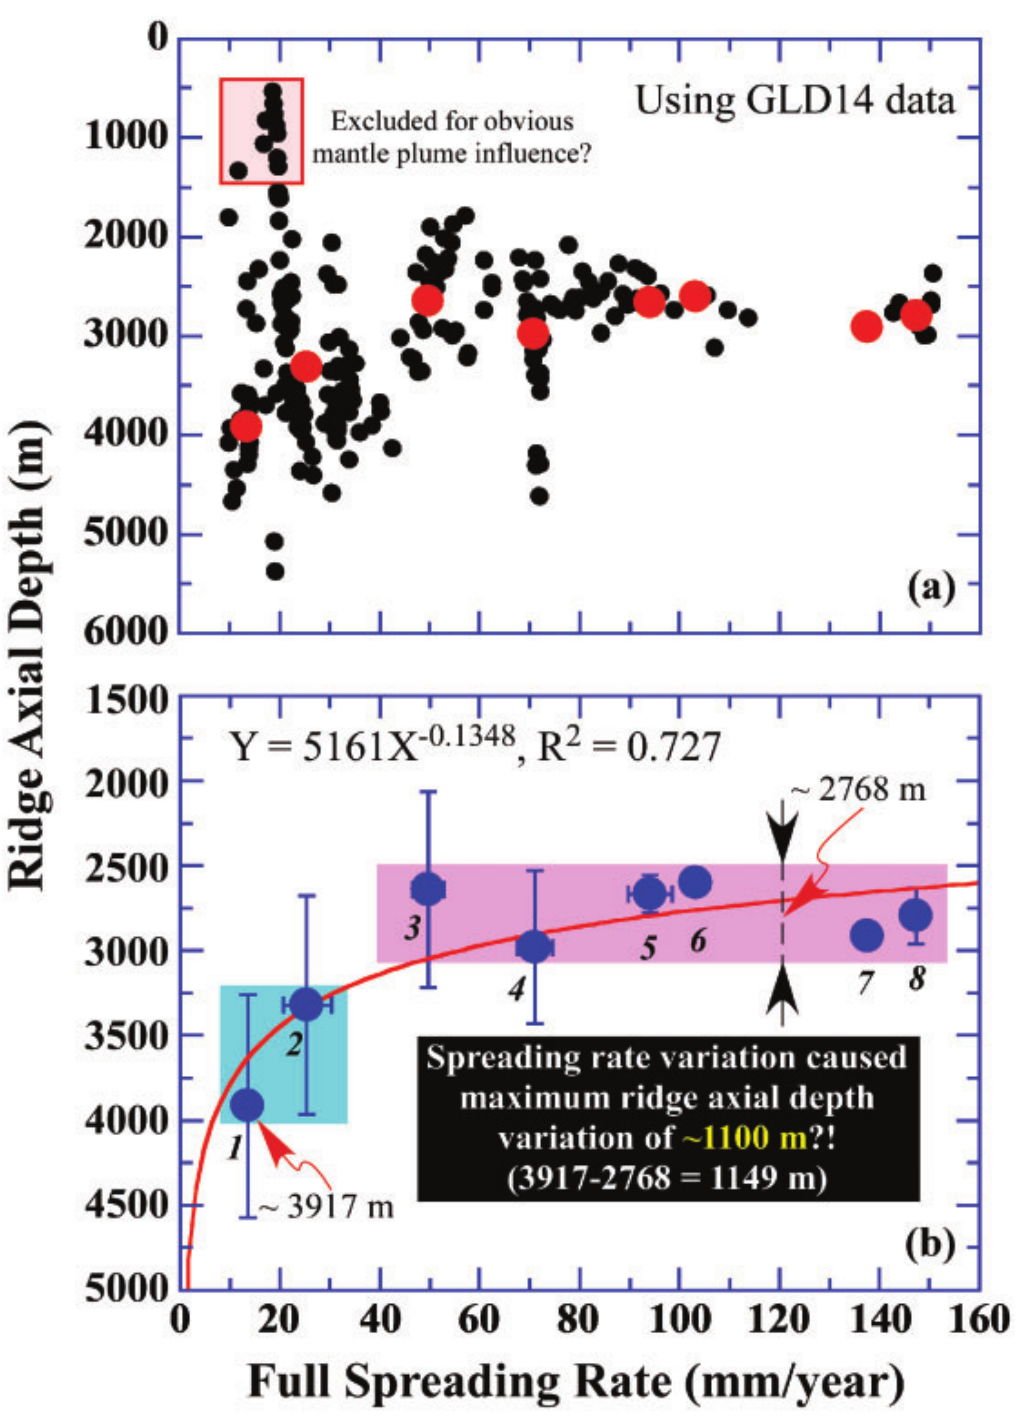
Variations in spreading rate?
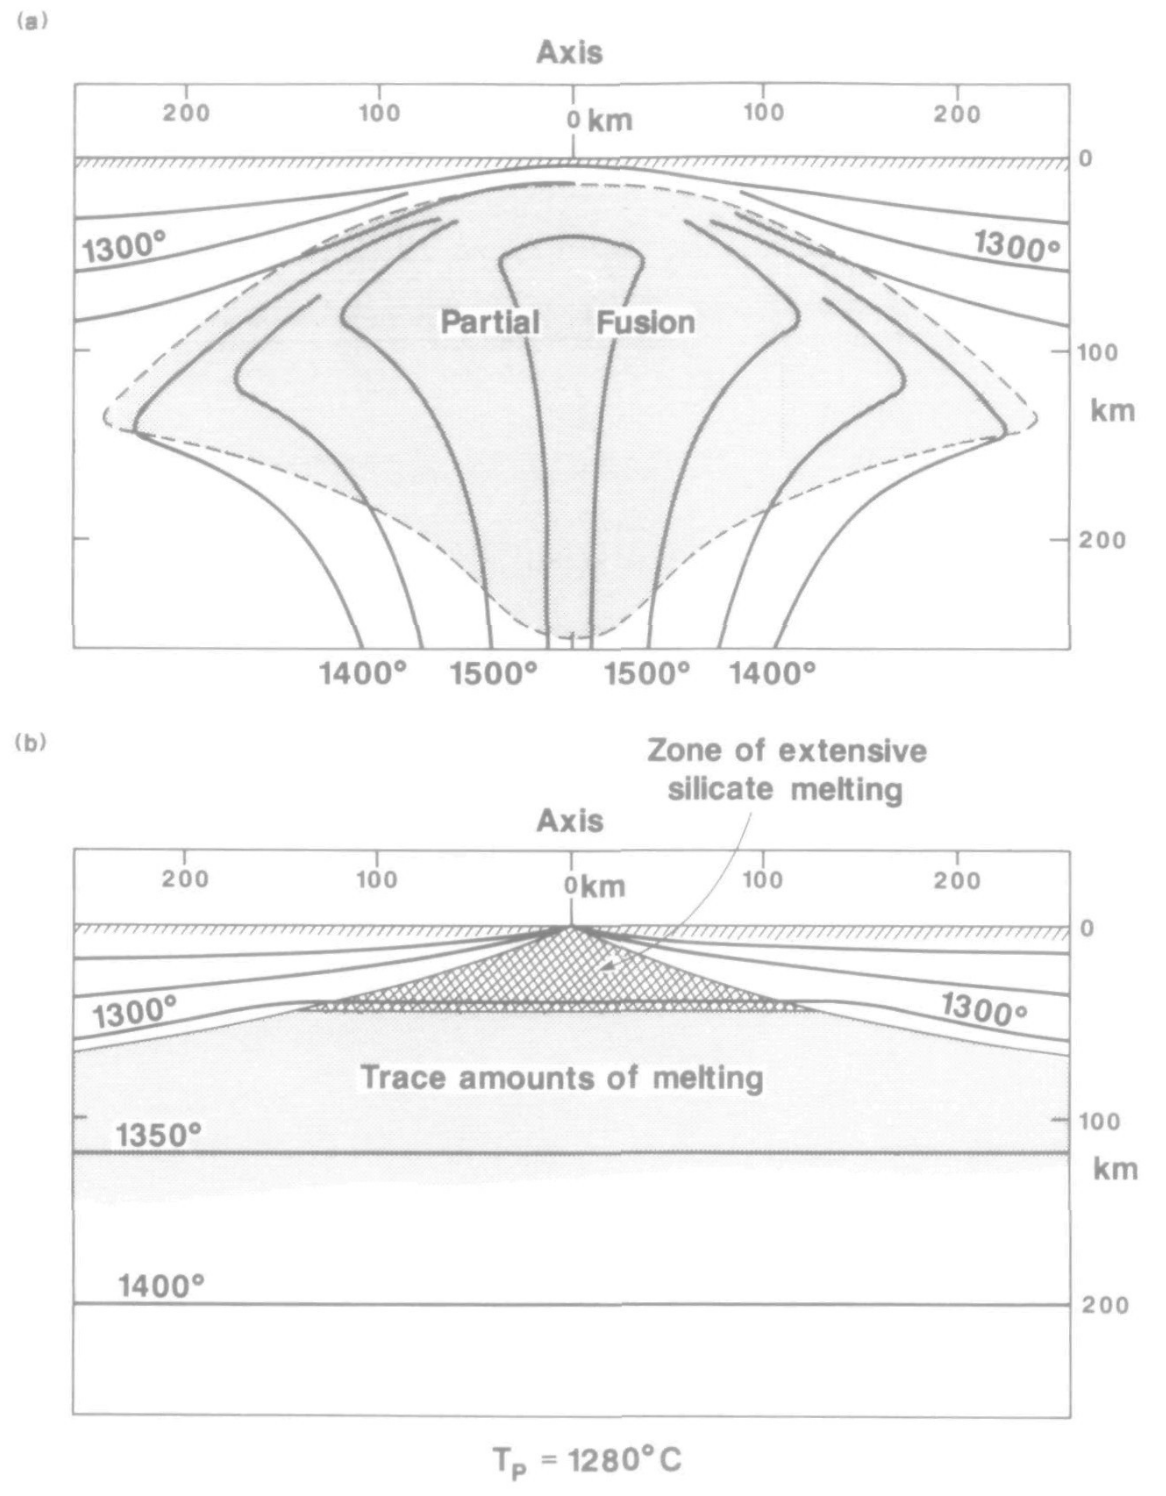
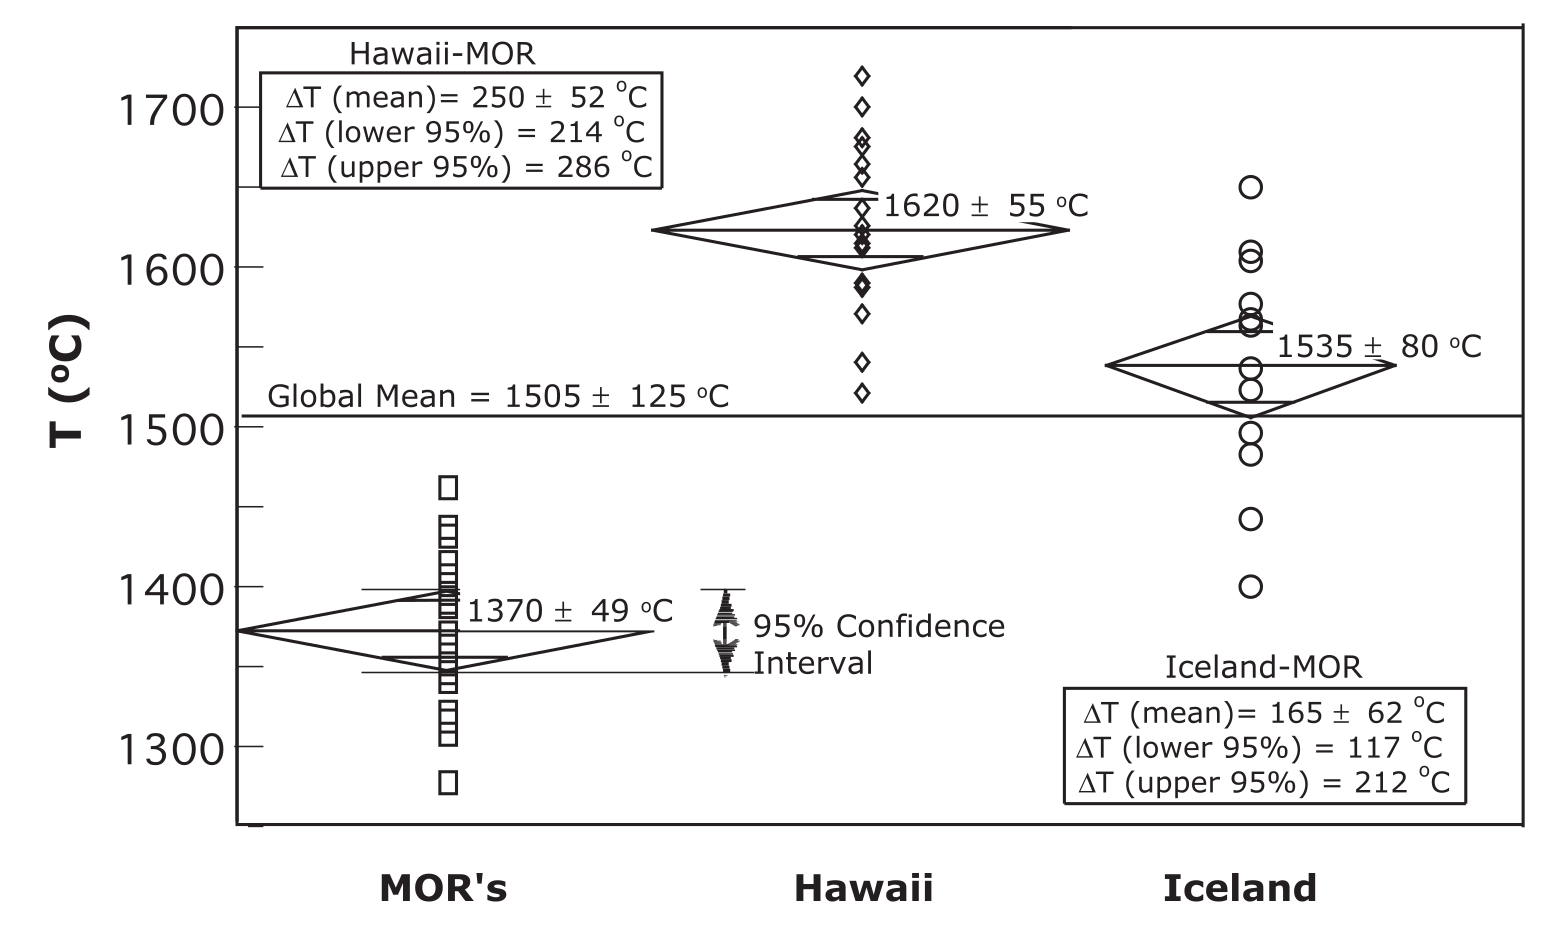
Potential temperatures beneath ridges and oceanic islands
The partitioning of Mg in Olivine is sensitive to temperature while the Fe/Mg partitioning is not
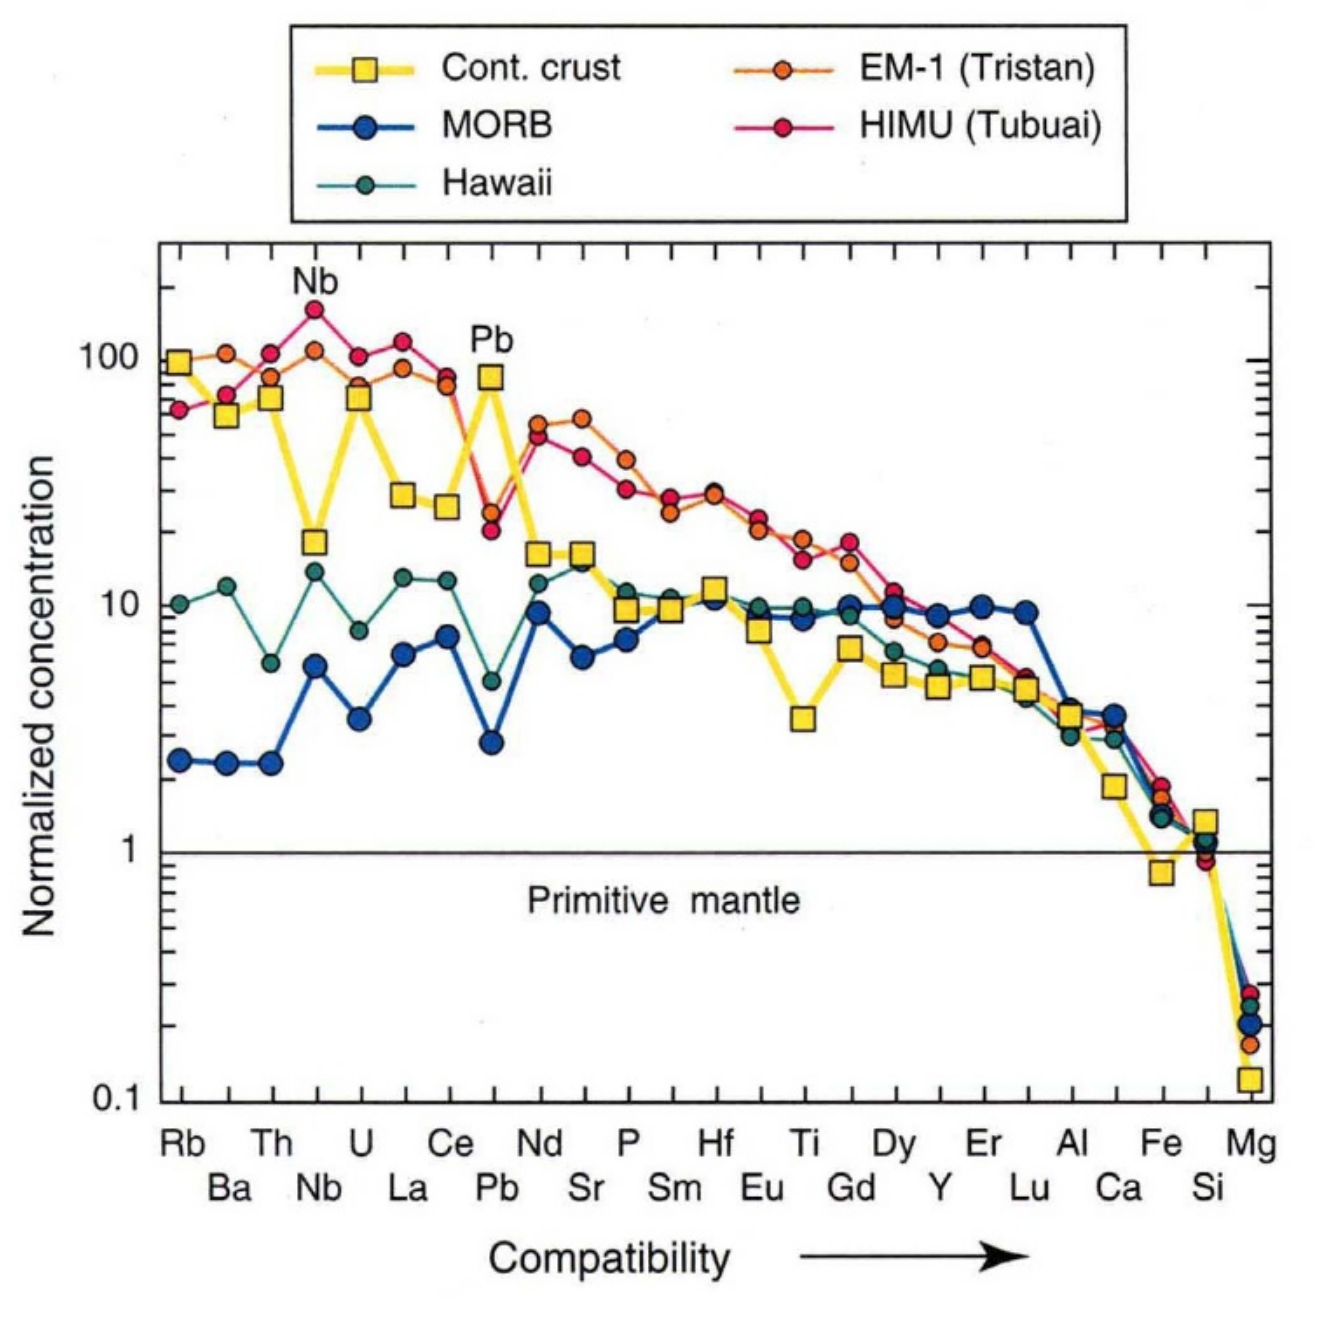
Trace elements in MORB and OIB (review compatibility trends)
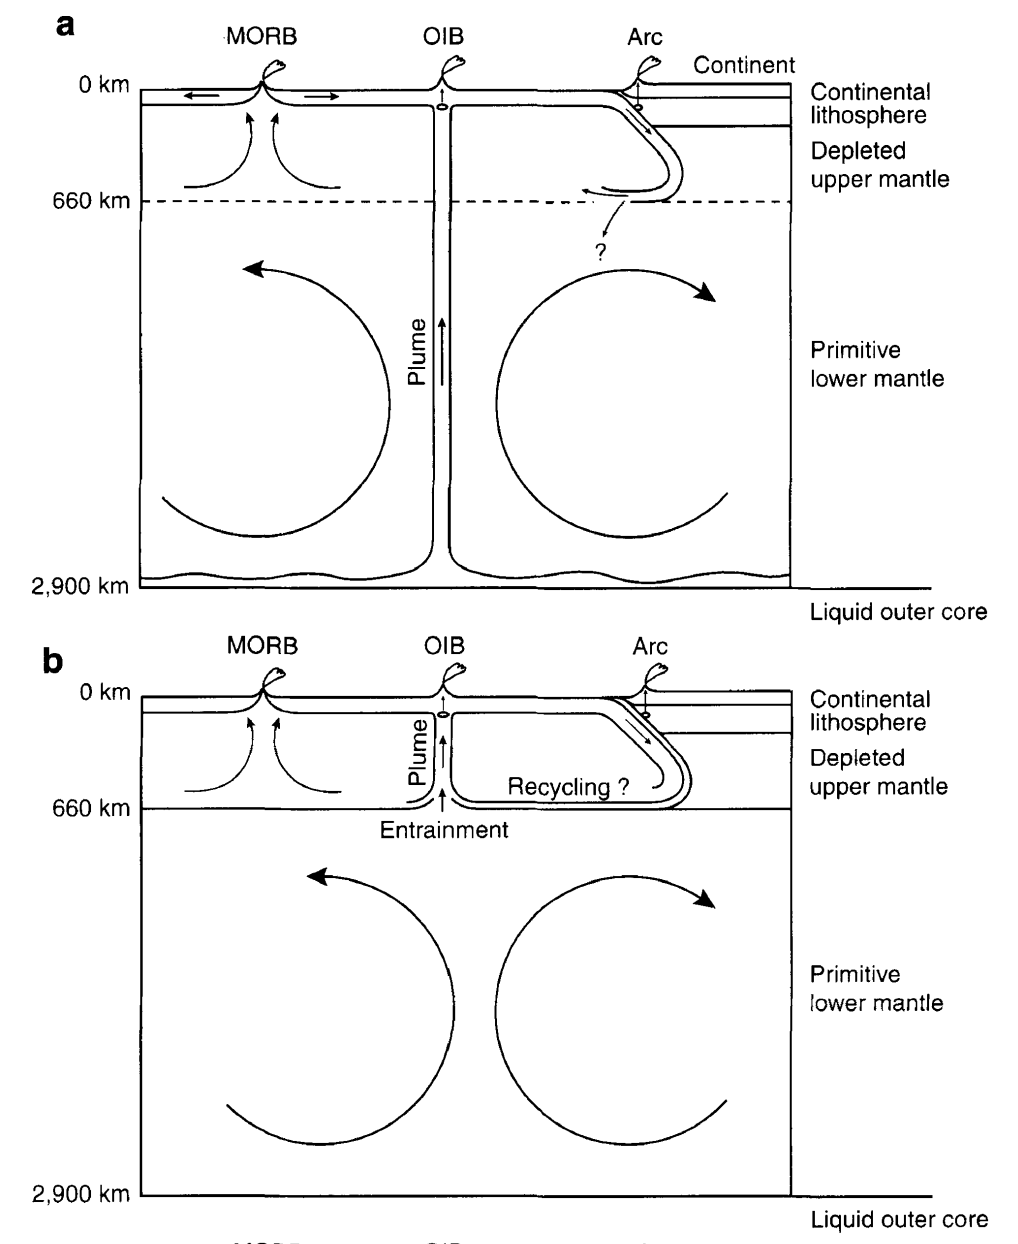
Models of the mantle
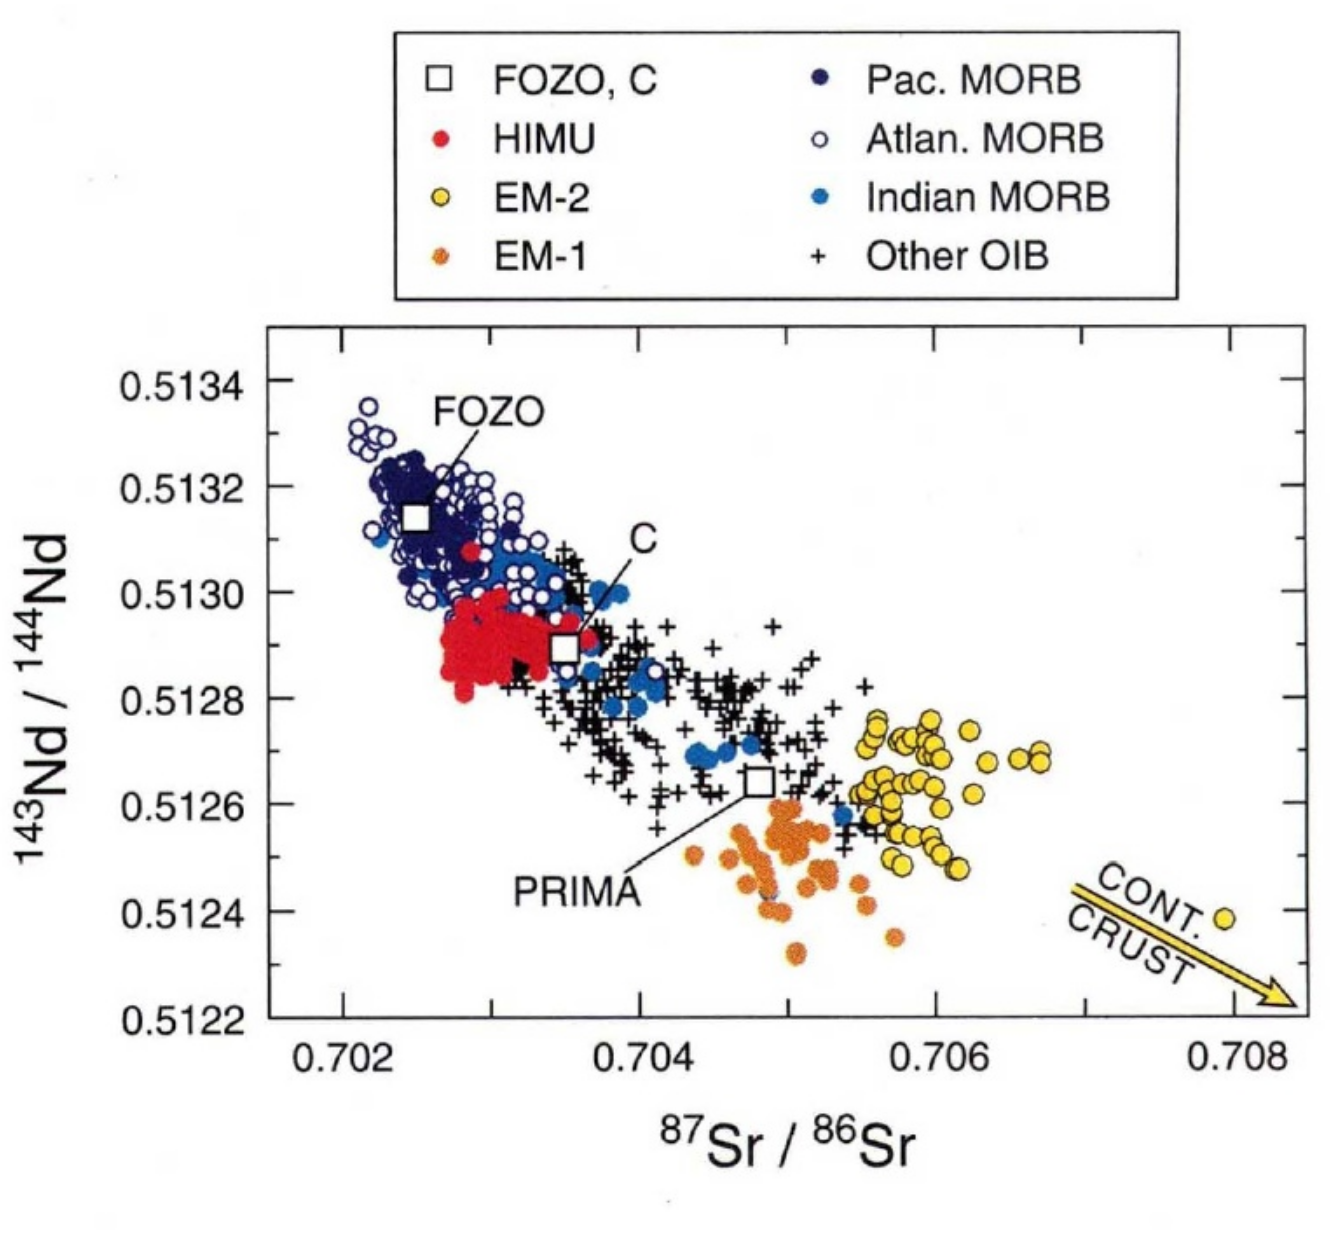
Sm and Rb
- $^{147}$Sm$\rightarrow^{143}$Nd
- Sm more compatible than Nd
- $^{87}$Rb$\rightarrow^{87}$Sr
- Rb highly incompatible (and more incompatible than Sr)
- What trends do you expect between primitive mantle, MORB, and continental crust?
- If plumes sample primitive mantle, what should their radiogenic Nd and Sr look like?
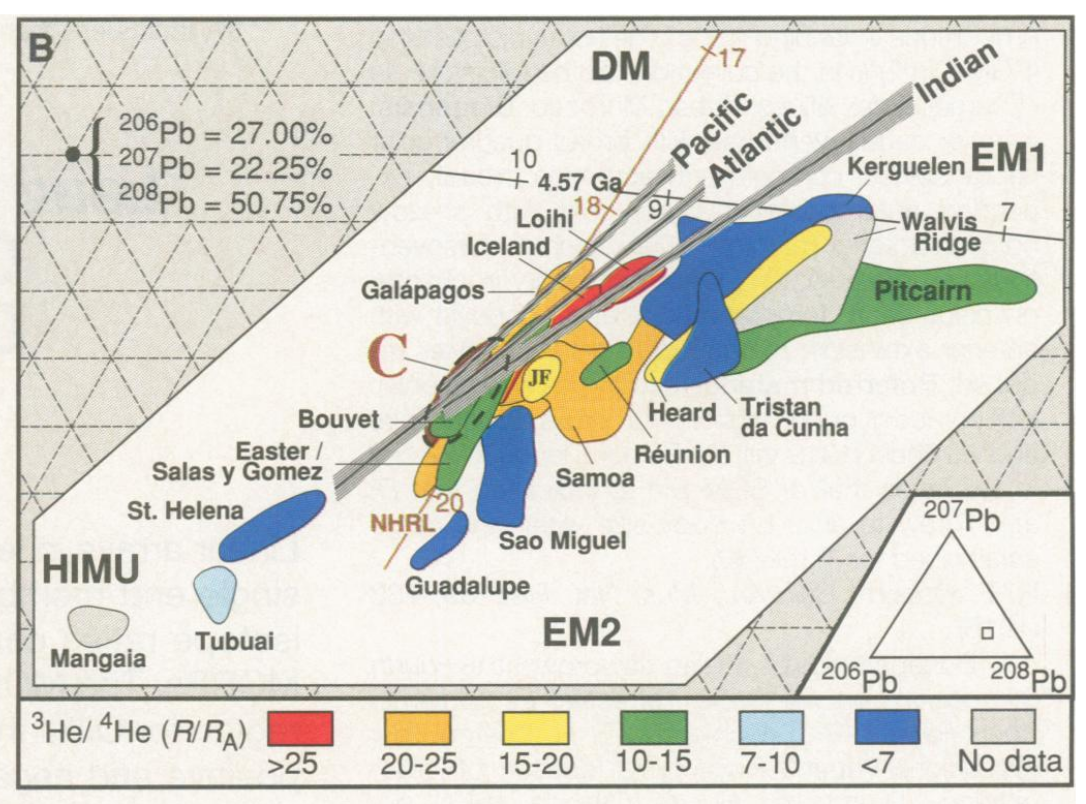
3He/4He
- atmospheric 3He/4He ratio = 1.4x10⁻⁶
- continental crust has low ratios 3He/4He = 0.01 RA
- MORB have rather uniform values of 8 $\pm$ 1 RA
- OIB range from 5 to 30
3He/4He
- atmospheric 3He/4He ratio = 1.4x10⁻⁶
- continental crust has low ratios 3He/4He = 0.01 RA
- MORB have rather uniform values of 8 $\pm$ 1 RA
- OIB range from 5 to 30
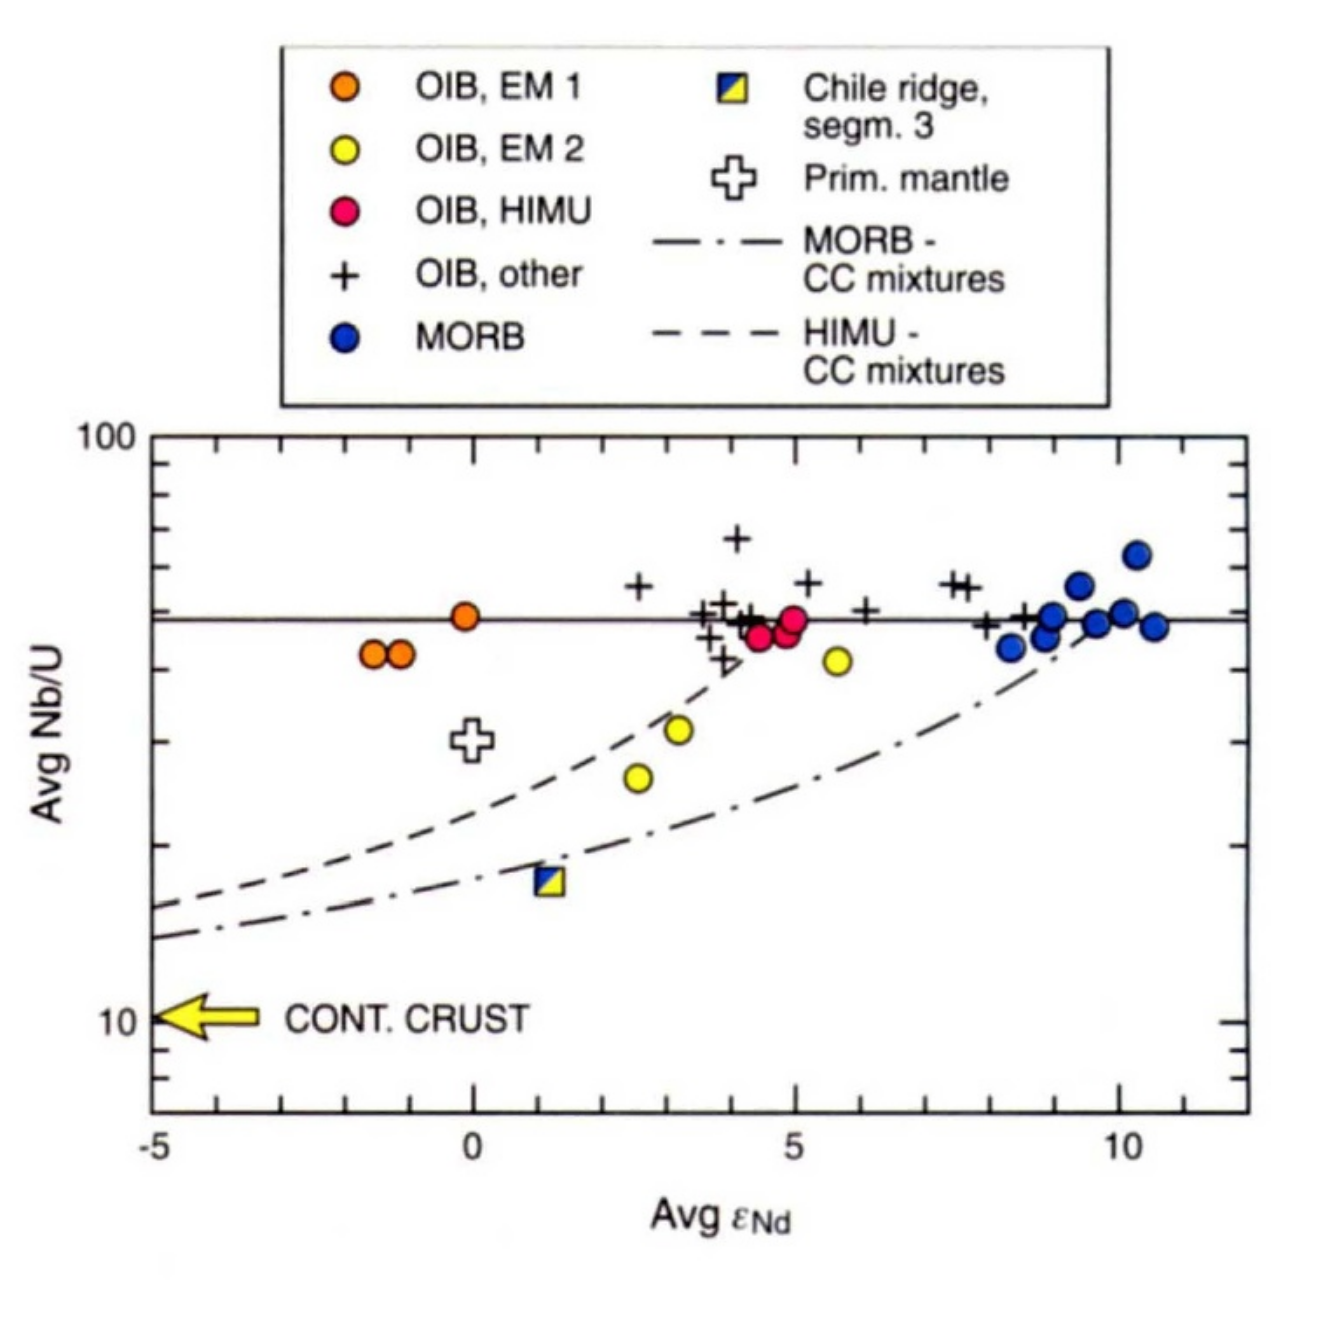
Nb/U should trace continental material
- OIBs have MORB-like Nb/U ratios, suggesting that they sample the same recycled source material
- $^{3}$He/$^{4}$He ratios can be high in some ocean island basalts, hard to reconcile with a common source for MORB and OIB
Models of the mantle
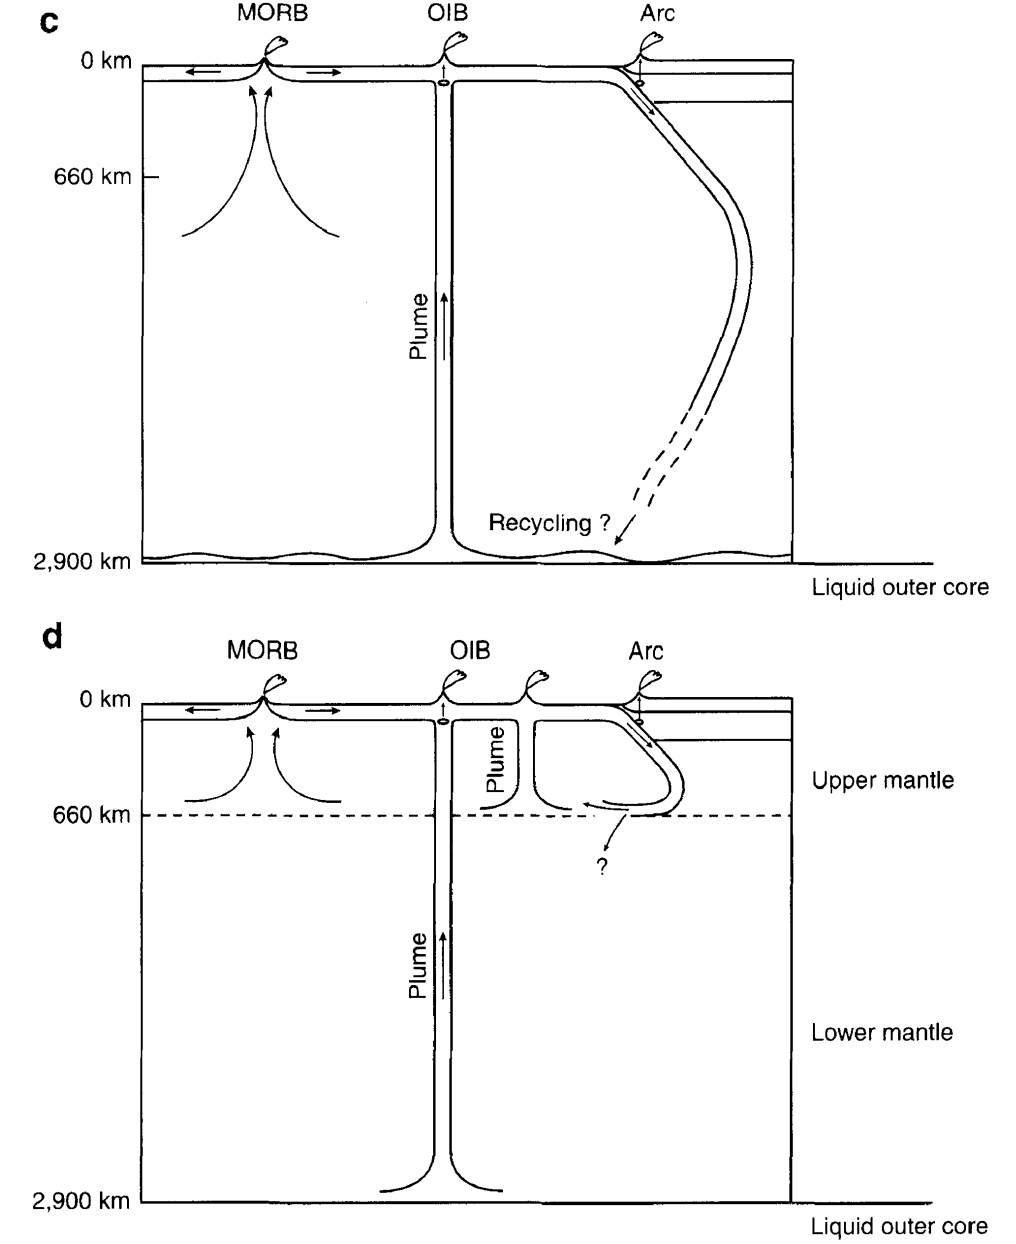
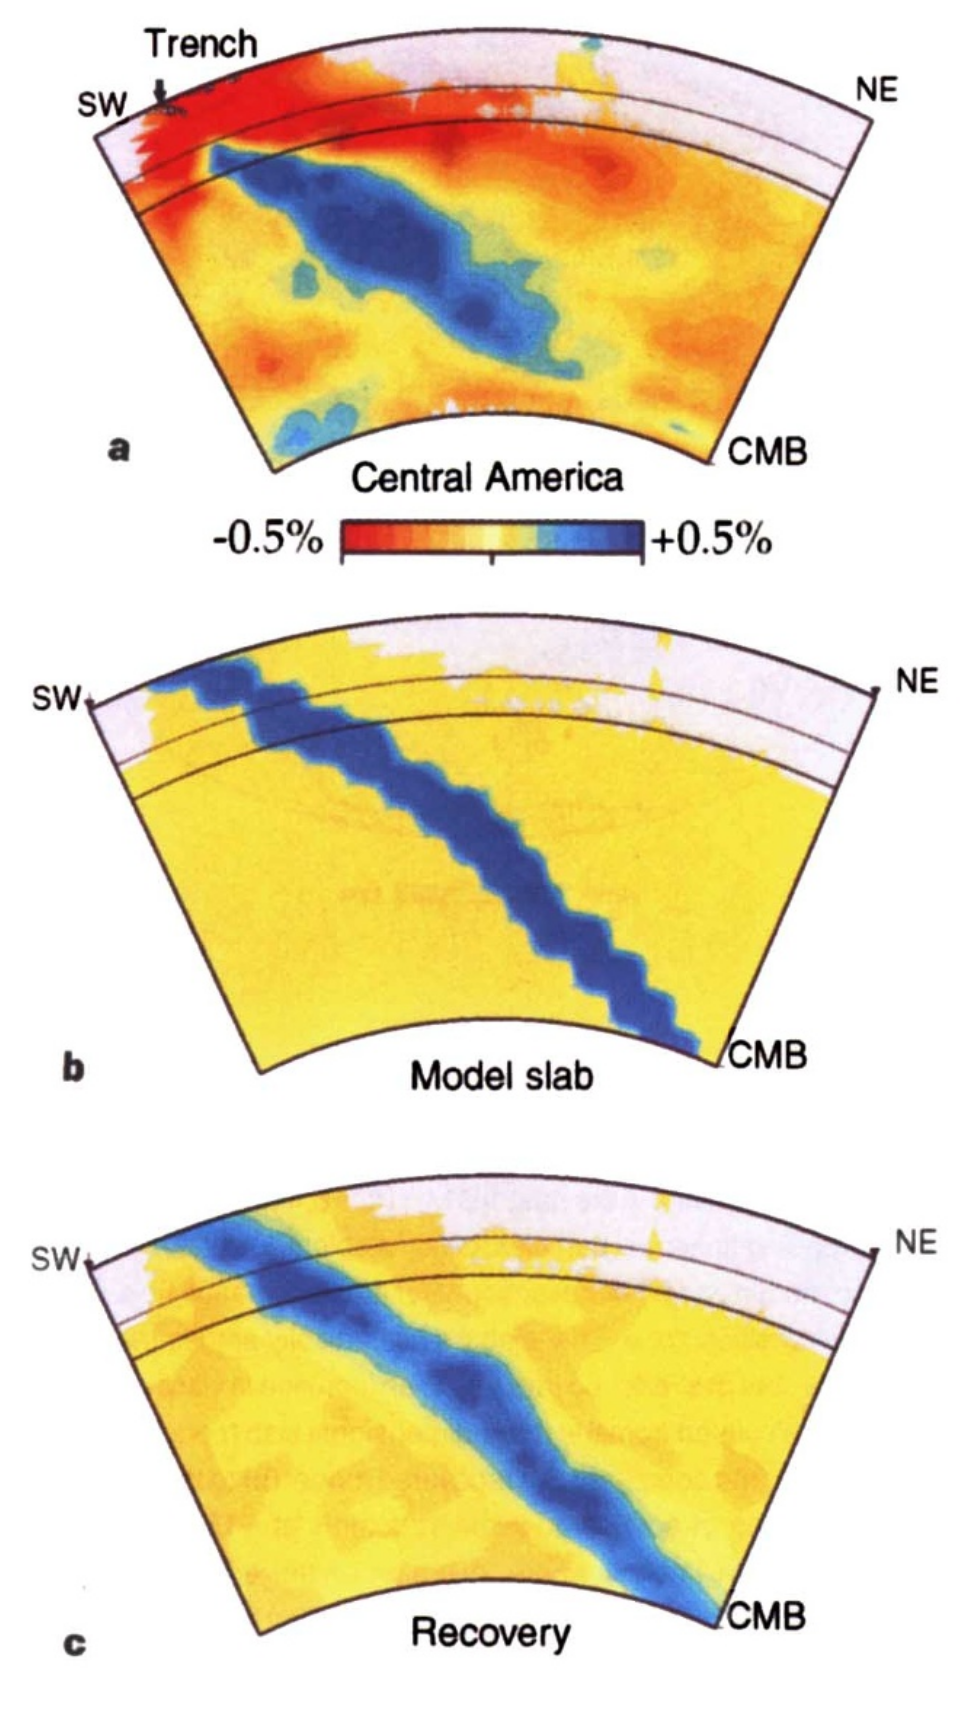
The fate of slabs
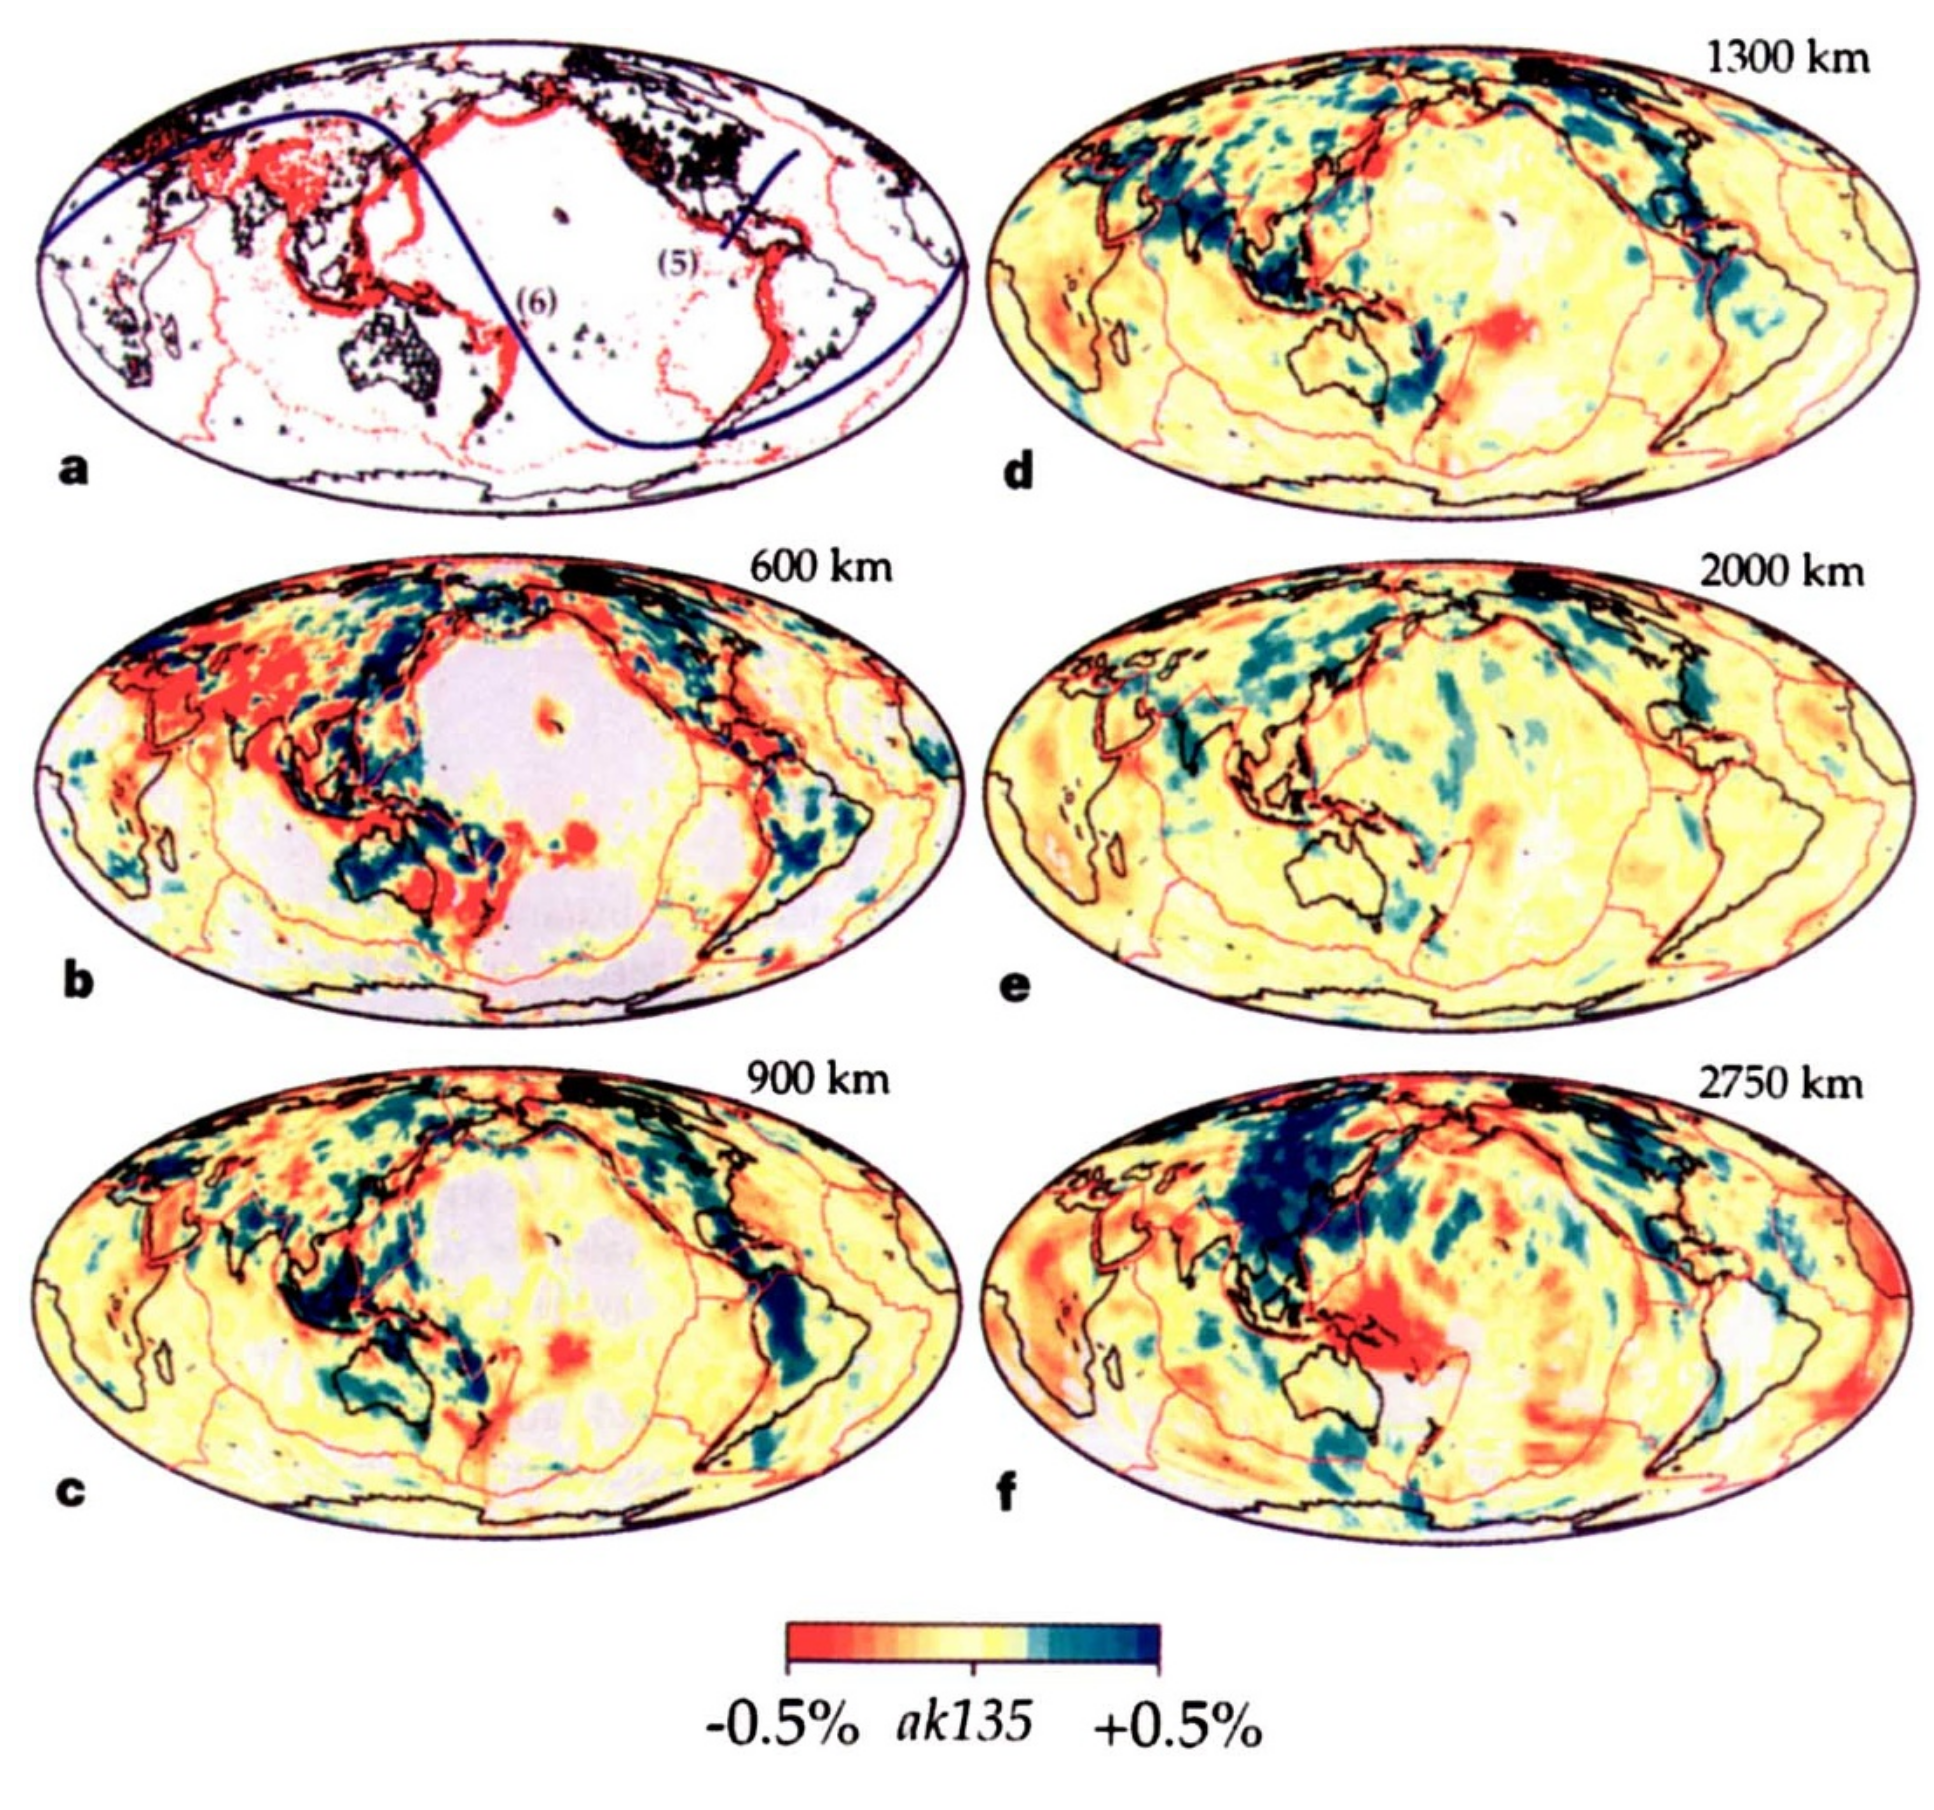
The fate of slabs
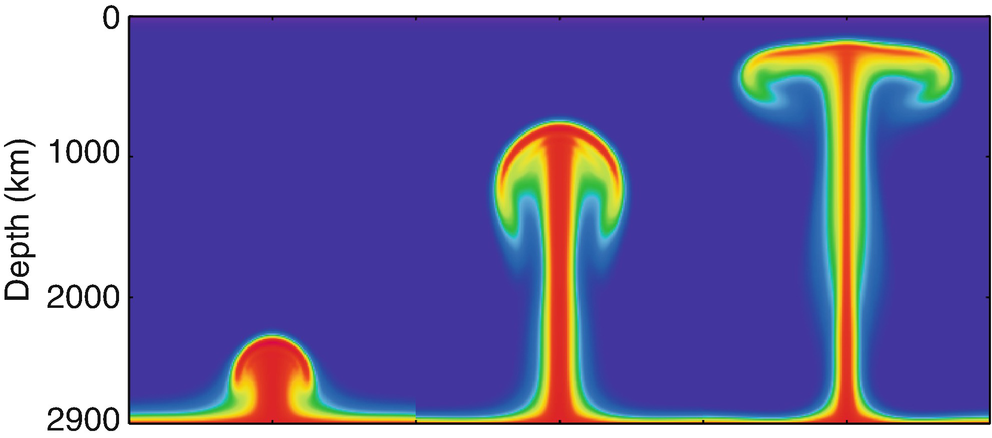
Thermal Plume simulations
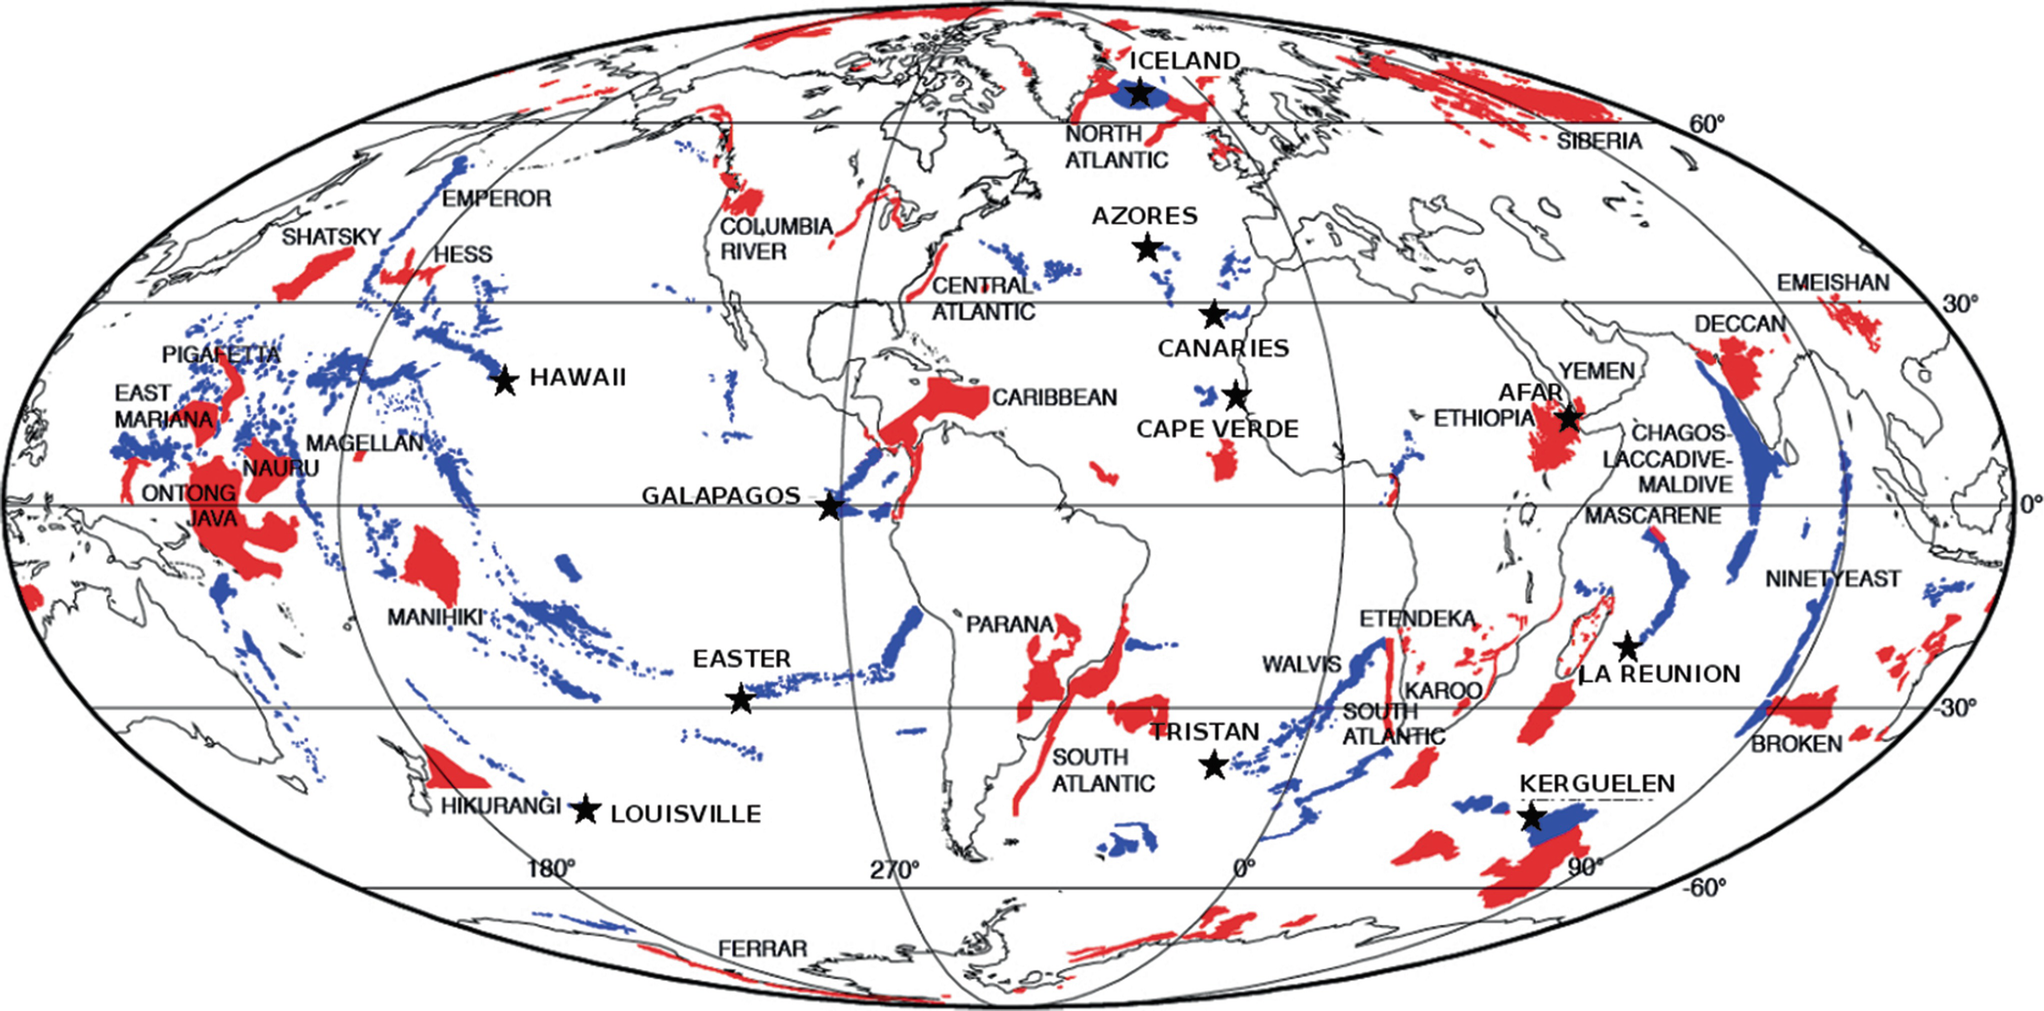
Large igneous provinces and flood basalts
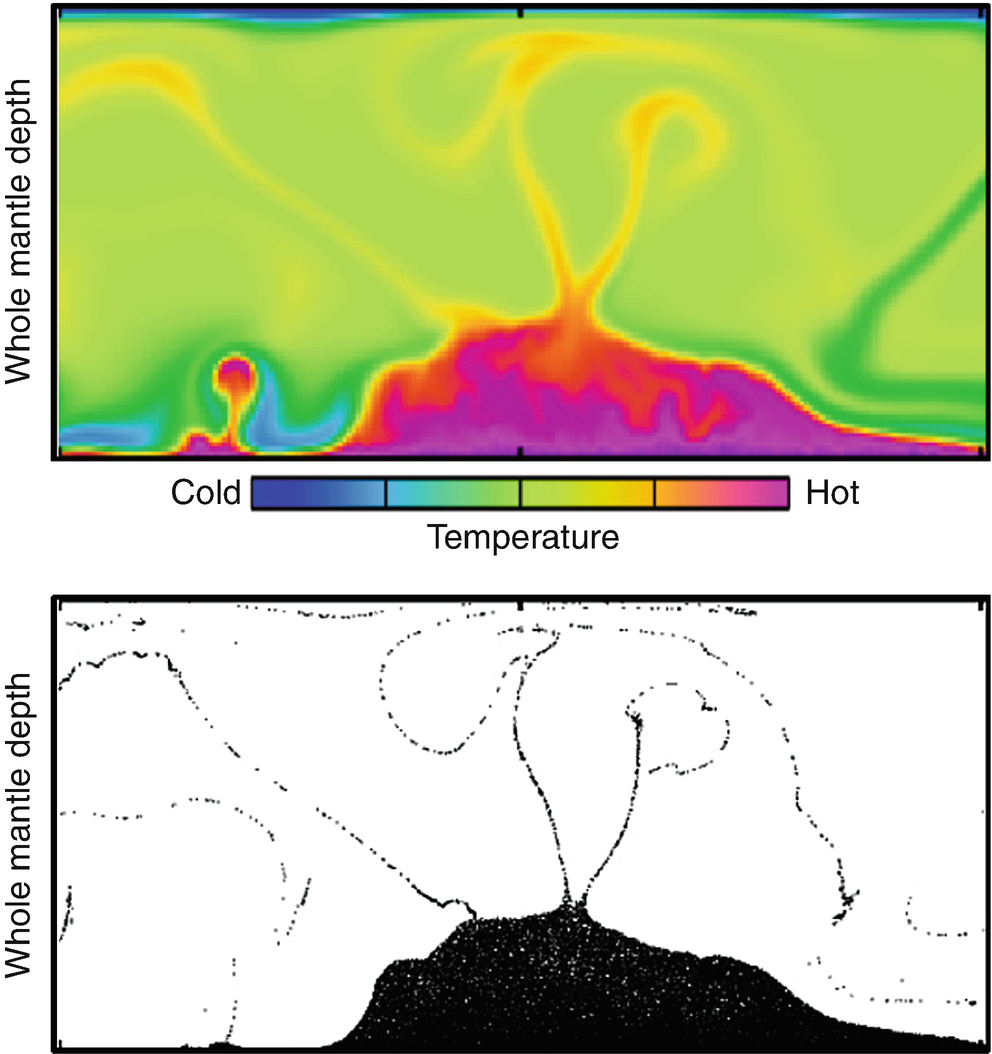
Thermochemical plumes
Breaking the mold
Breaking the mold
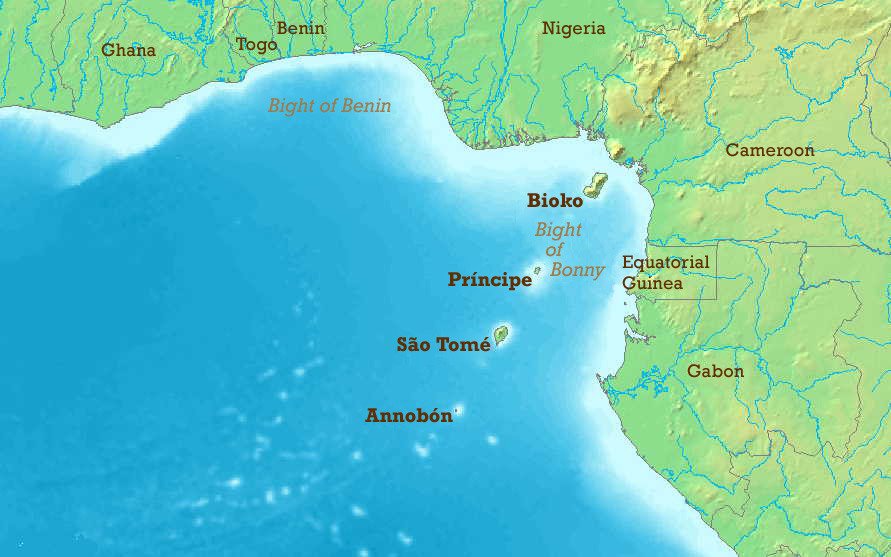
- Ages:
- Bioko: active
- Pricipe: ~6 Ma
- Sao Tome: ~1-3 Ma
- Continental volcanos: ~1-3 Ma
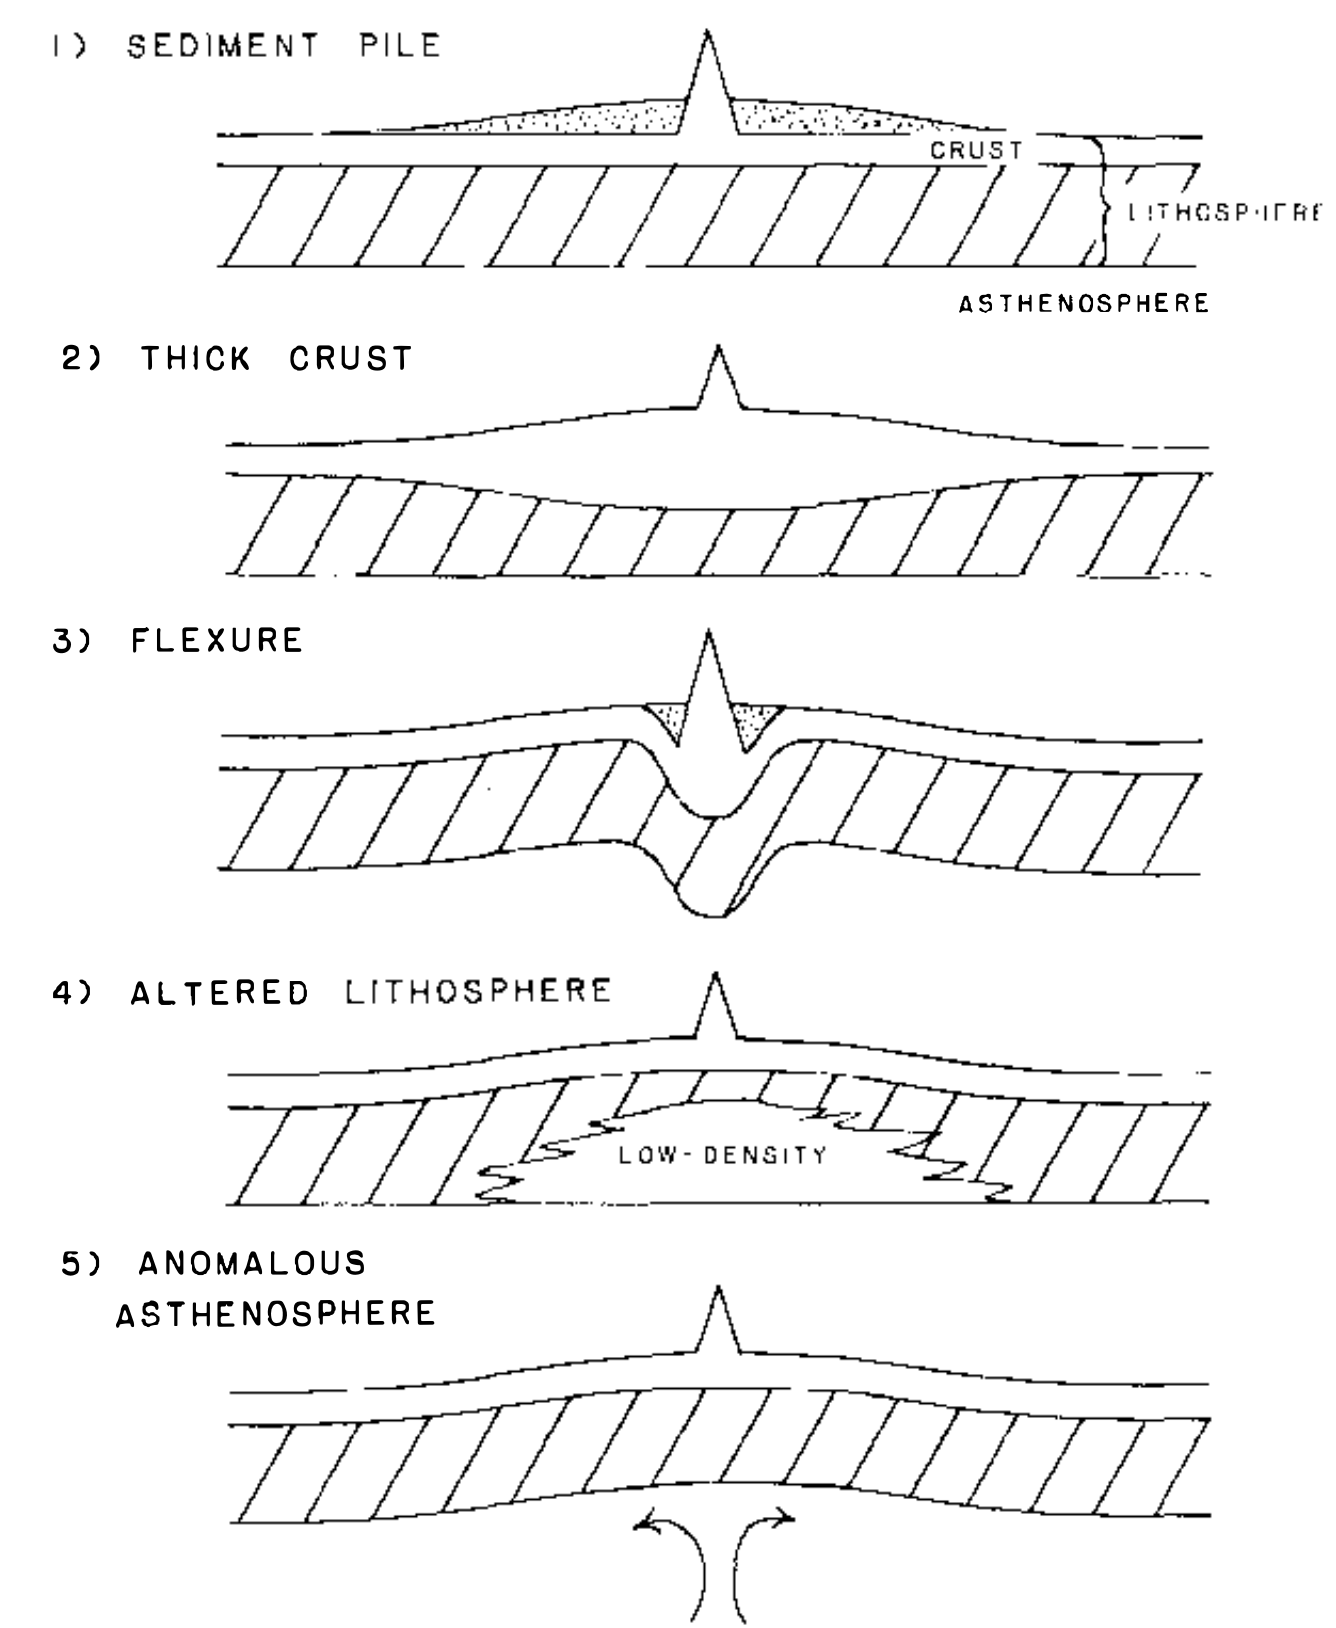
Are swells actually supported by thinner lithosphere?
Are swells actually supported by thinner lithosphere?
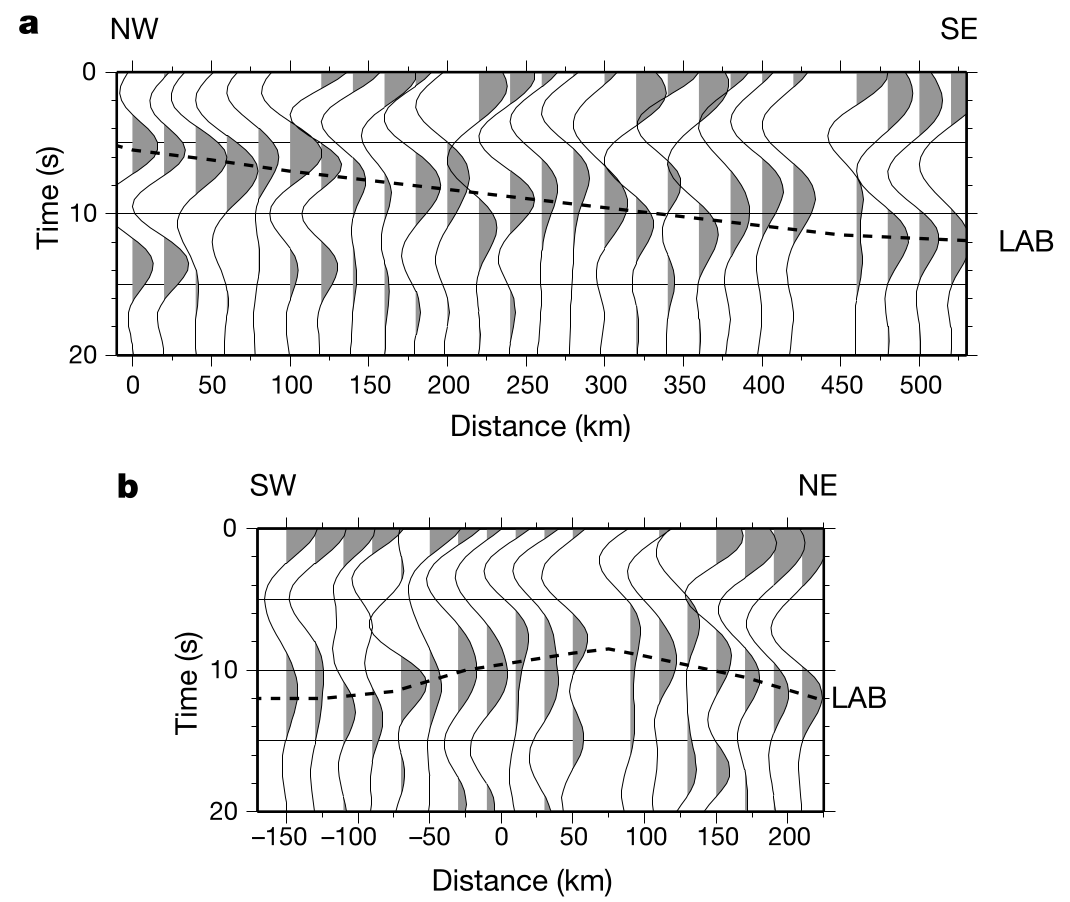
Are swells actually supported by thinner lithosphere?