Lecture 2: Simplifying Surface Transport
- Motivation: the stratigraphic record
- An example
- Modeling basin fill
- What is diffusion?
- Numerical example
- Diffusive flux: what is it in words and math
- Continuity equation: what is it in words and math
- Diffusion as a transport mechanism
- Assignment 1: diffusive transport
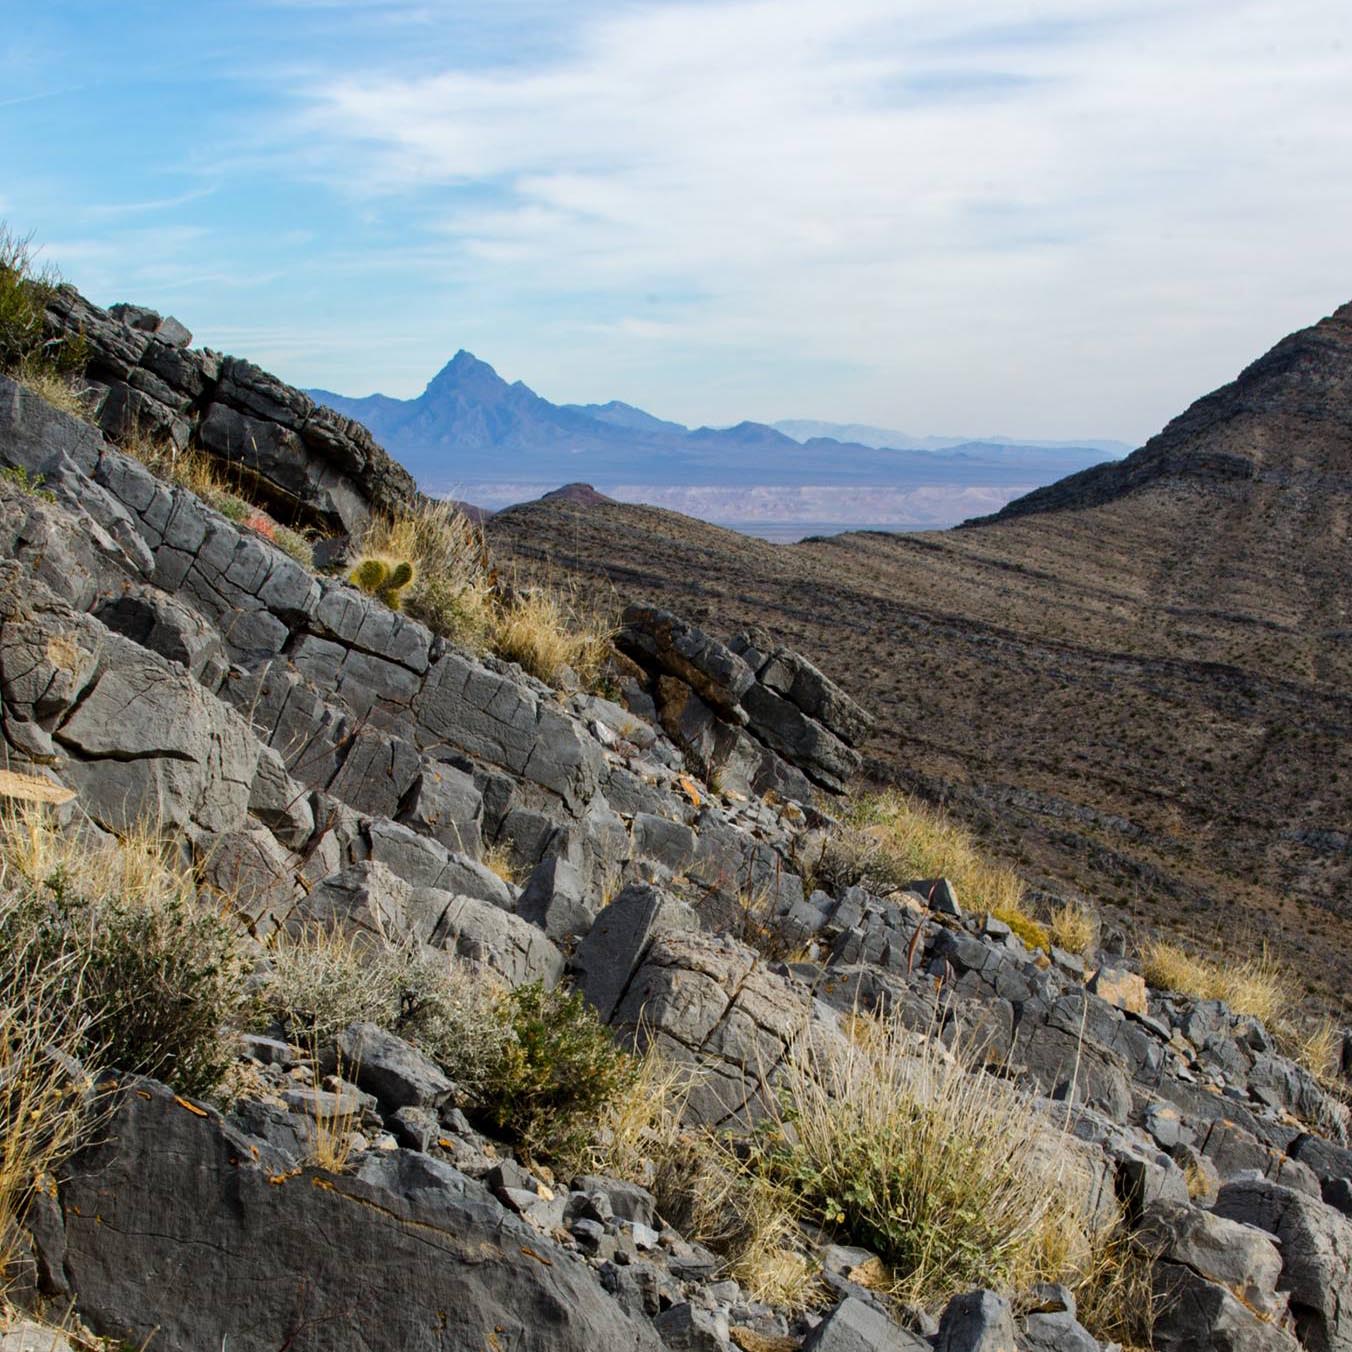
Po River (Italy)
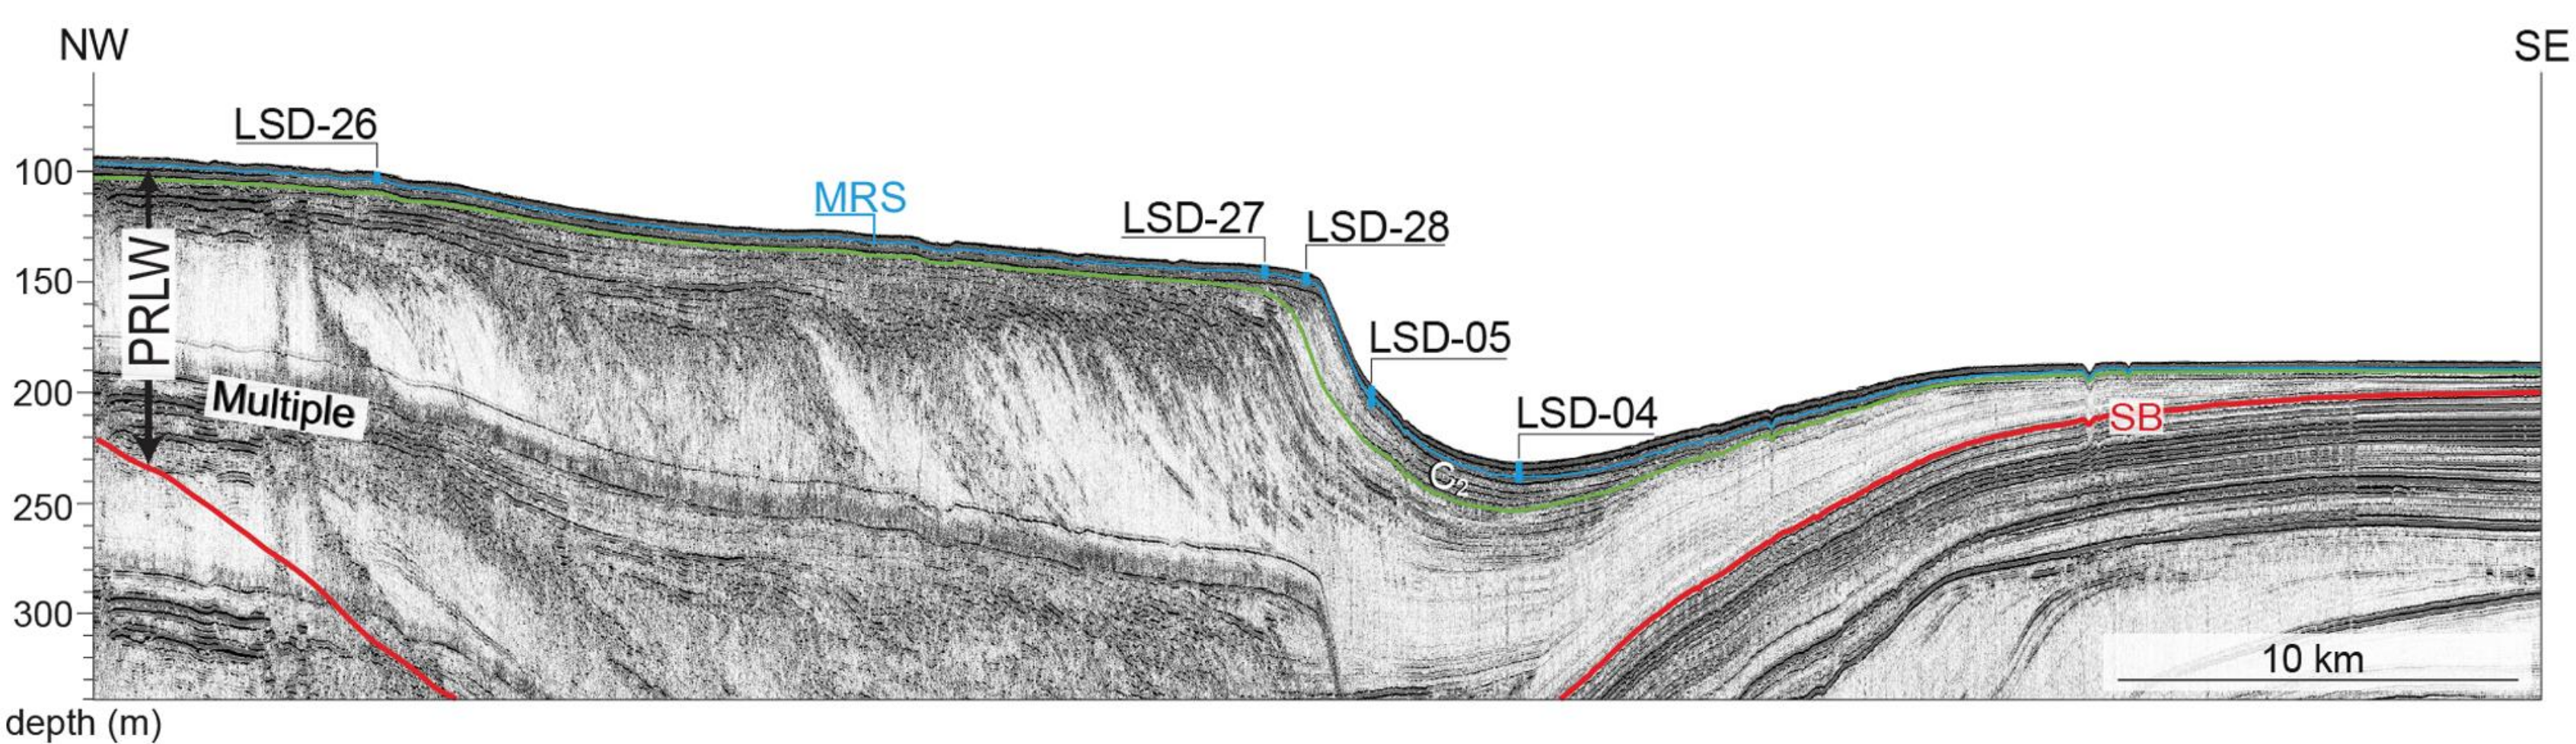
Po River (Italy)
Class observations/interpretations
- topsets (flat lying reflectors behind foresets) seem to indicate local sea level rise
- foresets prograde (move into the basin) and maybe increase a little bit in elevation
Simulating basin fill
Forward models can be used to explore some of these complex interactions. Generally there are two types of numerical models:
- complex fluid-flow models (think about the complexity of coastal dynamics)
- use very real physical equations to simulate movement in 3-D of each grain
- need accurate and high resolution data
- computationally expensive
- challenging to learn from or compare to stratigraphic data
- empirical transport models
- approximate transport laws combined with conservation equations (diffusion)
- does not mimic in detail each geologic process
- computationally inexpensive
- model outputs can be easily compared to real data
What is diffusion?
Lets take a look at some examples of diffusion..
A working definition of diffusion: is the net movement of anything (for example, atom, sediments, energy) from a region of higher concentration to a region of lower concentration.
Note that it is the complex interaction of particles above that causes diffusion, not some inherent desire to randomly move.
In Chemistry, Diffusion describes the process where entropy is increased as concentration gradients (chemical potential) are erased. How might diffusion be useful to describing sedimentary transport?
Diffusion is a good predictor of the net effect many transport related processes such as tidal currents, storms, bioturbation, the growth and death of reefs, etc.
- acts to decrease topographic gradients (gravitational potential energy)
- useful for building intuition about the stratigraphic record
The key here is that we can estimate the net change without understanding the details of every interaction.
Numerical example
If diffusion is the result of complex interactions, we can simulate those processes with random motion, and explore the system with a simple script. First, let's create a 2D world of 0's and 1's and introduce random motion.
Import some tools
import numpy as np
from matplotlib import pyplot as plt
from tqdm.notebook import tqdm
import seaborn as sns
sns.set_context('talk')
%matplotlib inline
row=[True]*10+[False]*10
row=[row]*1000
row=np.array(row)
print(row)
new_row = np.copy(row)
[[ True  True  True ... False False False]
 [ True  True  True ... False False False]
 [ True  True  True ... False False False]
 ...
 [ True  True  True ... False False False]
 [ True  True  True ... False False False]
 [ True  True  True ... False False False]]
fig=plt.figure(figsize=(12,6))
plt.subplot(2,1,1)
plt.imshow(row,interpolation='nearest')
plt.gca().set_aspect(1/250)
plt.gca().set_xticks([])
plt.gca().set_yticks([])
plt.subplot(2,1,2)
plt.plot(np.arange(20),np.sum(row,axis=0))
plt.gca().set_xticks(np.arange(20))
plt.gca().set_title('number of yellows: %2.0f' % (np.sum(row)))
plt.gca().set_aspect(1/250)

Introduce random motion
for n in range(10):
    row=np.copy(new_row)
    for i in range(1,1000-1):
        for j in range(1,20-1):
            change_x = np.random.choice([-1,0,1])
            change_y = np.random.choice([-1,0,1])
            new_row[i,j] = row[i+change_x,j+change_y]
def make_fig(row,show_grad=False):
    fig=plt.figure(figsize=(12,6))
    plt.subplot(2,1,1)
    plt.imshow(row,interpolation='nearest')
    plt.gca().set_aspect(1/250)
    plt.gca().set_xticks([])
    plt.gca().set_yticks([])
    plt.subplot(2,1,2)
    plt.plot(np.arange(20),np.sum(row,axis=0))
    plt.gca().set_xticks(np.arange(20))
    plt.gca().set_title('%% change in yellows: %2.2f' % (100*np.sum(row)/10000-100))
    plt.gca().set_aspect(1/250)
    if show_grad:
        plt.gca().twinx().plot(np.arange(1,21),np.gradient(np.sum(row,axis=0)),color='r',label='gradient')
        plt.gca().legend(loc='best')

make_fig(row)

So how do we describe the change in the amount of yellow?
make_fig(row,show_grad=True)

where is the diffusive flux largest?
- Flux is largest where the gradient is largest (they are proportional)
Diffusive flux: what is it in words
Lets consider a property, $u$, that is distributed over some spatial grid, $x$. We are interested in what happens to $u$ when we introduce random transport (diffusion).
- Diffusion occurs when a (1) conservative property ($u$, like mass, energy, momentum) moves through space (2) at a rate proportional to a gradient
Let's go through number 2 first:
- [tranportation rate of $u$] is proportional to [ change in amount of $u$ over some distance ]
- [the flux $Q_u$] is proportional to [ the spatial gradient of $u$]
Diffusive flux: what it is in math
The diffusive flux, $Q_u$ is proportional to the spatial gradient of $u$ :
$$\begin{equation} \color{blue}{ Q_u} \propto \color{red}{- \dfrac{\Delta u}{\Delta x}} \end{equation}$$or introduce a proportionality constant, $K$, and now talk about infinitisimal changes ($\partial$ vs. $\Delta$):
$$\begin{equation} \color{blue}{Q_u} = \color{red}{- K \dfrac{\partial u}{\partial x}} \end{equation}$$
- the flux constant is negative to indicate a transfer from regions of higher $u$ values to lower
Continuity equation: what is it in words
- Diffusion occurs when a (1) conservative property ($u \rightarrow$ like mass, energy, momentum) moves through space (2) at a rate proportional to a gradient
- Now, let's tackle point number one (mass balance):
- [change in $u$ with time] is equal to [ change in transport rate of $u$ with distance ]
- [rate of change in $u$] is equal to [ the flux gradient of $u$]
Continuity equation: what is it in math
This equality is known as the continuity equation (conservation of mass/energy/momentum):
$$\begin{equation}
\color{blue}{ \dfrac{\Delta u}{\Delta t}} = \color{red}{- \dfrac{\Delta Q_u}{\Delta x}} = \color{red}{- \dfrac{Q_2 - Q_1}{x_2 - x_1}}
\end{equation}$$
Or in proper mathematical terms:
$$\begin{equation}
\color{blue}{\dfrac{\partial u}{\partial t}}
\color{black}{= }
\color{red}{- \dfrac{\partial Q_u}{\partial x}}
\end{equation}$$
if Q2 > Q1, then u will:
if Q2 < Q1, then u will:
if Q2 = Q1, then u will:
How is this equation a conservation of mass?
By combining these two equations, we can show $u$ will change over time as a function of the second spatial derivative of $u$ (the curvature):
| Diffusive flux | Continuity equation |
|---|---|
| $Q_u= -K\dfrac{\partial u}{\partial x}$ | $\color{blue}{\dfrac{\partial u}{\partial t}} \color{black}{= } \color{red}{- \dfrac{\partial Q_u}{\partial x}}$ |
Applying the diffusion equation to a physical system has two general requirements:
- transport / transfer is proportional to a gradient
- conservation of mass or energy
Diffusion as a transport mechanism
When we assume that diffusive transport exerts an important control on landscape dynamics we generally accept that particles on the surface of the planet are in constant complex motion, and there is some downslope bias introduced by gravity to those motions. Over time, diffusion can be assumed to smooth topography (by the transport of material downslope).
A look ahead
Over the next few weeks in your assignments you will be building a 1-D diffusive transport model to explore how variations in the following properties change the stratigraphic architecture of a basin:
- transport
- sediment supply
- accomodation space
An example: varying accomodation space
animate_beds(beds=beds,otime=otime,rsl=rsl,aspect=5, ymin=-100)
