Lectures 7-9: Stratigraphic Sequences
- Hands on with our transport model
- Constant Subsidence and Constant Sediment Flux
- Shut off sediment source
- Variable Sea Level and Constant Sediment Flux
- Constant Subsidence and Constant Sediment Flux
- Stratigraphic Sections: blind men and the elephant
- Context
A more powerful diffusion model
We now have a fairly powerful 1-D diffusive transport model and will begin exploring the stratigraphic architecture of a basin is a function of:
- transport
- sediment supply
- accommodation space
Why are we interested in understanding these processes?
Constant Sediment Flux
fig=plt.figure(figsize=(15,5))
dt = .1
total_time = 1000
base_level_rise=0
sns.set_palette('viridis',n_colors=11)
model = Diffuse1D(length=10000, spacing=10, tstep=dt, left=10, right=-20, K=2e2, var_K=False)
xt = np.linspace(0, total_time, 1000)
model.set_baselevel(xt, base_level_rise/total_time*xt)
beds = []
otime = []
rsl = []
beds.append(model.u)
otime.append(model.time)
rsl.append(model.base_level)
for k in range(int(total_time / dt)):
    model.run_step()
    #     model.set_left(model.base_level+10)
    if k % 10 == 0:
        pbar.set_description("Processing year %s" % np.round(model.time, 1).astype(int))
        beds.append(model.u)
        otime.append(model.time)
        rsl.append(model.base_level)
    if k % 1000 == 0:
        plt.plot(model.u,label="year %s" % np.round(model.time, 0))
plt.plot(model.u,label="year %s" % np.round(model.time, 0))
plt.gca().set_xlabel('Distance (10^1 m)')
plt.gca().set_ylabel('Elevation (vm)')
plt.gca().set_title('Constant Sea Level and Sediment Flux')
_=plt.legend(loc='best')

Constant Sediment Flux
fig
Is there any erosion?
What happens if we shut off sedimentation rate after some amount of time? What happens to the coastline?
fig=plt.figure(figsize=(15,5))
dt = .1
total_time = 1500
base_level_rise=0

model = Diffuse1D(length=10000, spacing=10, tstep=dt, left=10, right=-20, K=2e2, var_K=False)
xt = np.linspace(0, total_time, 1000)
model.set_baselevel(xt, base_level_rise/total_time*xt)

beds = []
otime = []
rsl = []

beds.append(model.u)
otime.append(model.time)
rsl.append(model.base_level)
sns.set_palette('viridis',n_colors=int(total_time / dt / 1000)+2)

for k in range(int(.75*total_time / dt)):
    model.run_step()
    #     model.set_left(model.base_level+10)
    if k % 10 == 0:
        pbar.set_description("Processing year %s" % np.round(model.time, 1).astype(int))
        beds.append(model.u)
        otime.append(model.time)
        rsl.append(model.base_level)
    if k % 1000 == 0:
        plt.plot(model.u,label="year %s" % np.round(model.time, 0))


model.sed_Q=0
for k in range(int(.25*total_time / dt)):
    model.run_step()
    #     model.set_left(model.base_level+10)
    if k % 10 == 0:
        pbar.set_description("Processing year %s" % np.round(model.time, 1).astype(int))
        beds.append(model.u)
        otime.append(model.time)
        rsl.append(model.base_level)
    if k % 1000 == 0:
        plt.plot(model.u,label="year %s" % np.round(model.time, 0))

plt.plot(model.u,label="year %s" % np.round(model.time, 0))
plt.gca().set_xlabel('Distance (10^1 m)')
plt.gca().set_ylabel('Elevation (m)')
plt.gca().set_title('Constant Sea Level and Sediment Flux\nSediment Shut Off at Year 1000')
_=plt.legend(loc='best',fontsize=8)

What happens if we shut off sedimentation rate after some amount of time? What happens to the coastline?
fig
What happens if the sediment flux returns?
Example 1: Constant Sea Level Change and Constant Sediment Flux
Now it is your turn to play with your model. Initialize your model with same boundary conditions from assignment 2 (set initial topography to the steady state solution -- a line).
#fix right and left boundaries
left_boundary = 10
right_boundary = -20
#set diffusivity
K = 2e2
#sediment flux at coastline
sed_Q = 10 #m^2/yr
You will run your model for 1000 years. In one simulation, bring sea level up 5 meters over the 1000 years (linearly). In a second simulation, drop sea level by 5 meters over the 1000 years. Answer the following questions for each simulation (it can help to plot the topography every 100 years or so).
- What does the coastline do?
- Where is erosion occurring?
number_of_loops = 100
topography = -30/1000*np.linspace(0,1000,1000)+10
sea_level = np.linspace(0,1000,number_of_loops)*(5/1000)
for i in range(number_of_loops):
    sl_at_this_timestep = sea_level[i]
#     print(sl_at_this_timestep)
    for k in range(len(topography)):
        if topography[k]<sl_at_this_timestep:
            coastline = k
#             print(k)
            break

#     ## np.where
#     np.where(topography<=sl_at_this_timestep)[0][0]

#     np.argmin(np.abs(topography-sl_at_this_timestep))
fig=plt.figure(figsize=(15,5))
dt = .1
total_time = 1000
base_level_rise=5

model = Diffuse1D(length=10000, spacing=10, tstep=dt, left=10, right=-20, K=2e2, var_K=False)
xt = np.linspace(0, total_time, 1000)
model.set_baselevel(xt, base_level_rise/total_time*xt)

beds = []
otime = []
rsl = []

beds.append(model.u)
otime.append(model.time)
rsl.append(model.base_level)

sns.set_palette('viridis',n_colors=int((.75*total_time / dt)/1000) + 2)

for k in range(int(.75*total_time / dt)):
    model.run_step()
    #     model.set_left(model.base_level+10)
    if k % 10 == 0:
        pbar.set_description("Processing year %s" % np.round(model.time, 1).astype(int))
        beds.append(model.u)
        otime.append(model.time)
        rsl.append(model.base_level)
    if k % 1000 == 0:
        plt.plot(model.u,label="year %s" % np.round(model.time, 0))

plt.plot(model.u,label="year %s" % np.round(model.time, 0))
plt.gca().set_xlabel('Distance (10^1 m)')
plt.gca().set_ylabel('Elevation (m)')
plt.gca().set_title('Constant Sea Level Rise (5 m) and Constant Sediment Flux')
_=plt.legend(loc='best',fontsize=8)

fig=plt.figure(figsize=(15,5))
dt = .1
total_time = 1000
base_level_rise=-5

model = Diffuse1D(length=10000, spacing=10, tstep=dt, left=10, right=-20, K=2e2, var_K=False)
xt = np.linspace(0, total_time, 1000)
model.set_baselevel(xt, base_level_rise/total_time*xt)

beds = []
otime = []
rsl = []

beds.append(model.u)
otime.append(model.time)
rsl.append(model.base_level)

sns.set_palette('viridis',n_colors=int((.75*total_time / dt)/1000) + 2)

for k in range(int(.75*total_time / dt)):
    model.run_step()
    #     model.set_left(model.base_level+10)
    if k % 10 == 0:
        pbar.set_description("Processing year %s" % np.round(model.time, 1).astype(int))
        beds.append(model.u)
        otime.append(model.time)
        rsl.append(model.base_level)
    if k % 1000 == 0:
        plt.plot(model.u,label="year %s" % np.round(model.time, 0))

plt.plot(model.u,label="year %s" % np.round(model.time, 0))
plt.gca().set_xlabel('Distance (10^1 m)')
plt.gca().set_ylabel('Elevation (m)')
plt.gca().set_title('Constant Sea Level Fall (5 m) and Constant Sediment Flux')
_=plt.legend(loc='best',fontsize=8)

Example 2: Sea Level Change and Constant Sed Flux
Now let's combine the past last two simulations. First drop sea level by 5 meters over 1000 years (regression), then bring sea level back up 5 meters over 1000 years (transgression). Answer the following questions:
- What does the coastline do? Specifically when does it change direction?
- When and where is erosion occurring?
- Describe the contact between year 1200 deposits and year 800 deposits
- What is the coastline doing at this time?
- Describe the contact between year 1900 deposits and year 100 deposits
- What is the coastline doing at this time?
The geometry of steeper-dipping beds that terminate against beds with shallower dip is called downlap (Coastline is generally regressing, or prograding). The geometry shallowly dipping strata terminating against more steeply dipping strata is called onlap (Coastline is generally transgressing).
sns.set_palette('viridis',n_colors=21)
fig=plt.figure(figsize=(15,5))
dt = .1
total_time = 2000
base_level_rise=5

model = Diffuse1D(length=10000, spacing=10, tstep=dt, left=10, right=-20, K=2e2, var_K=False)
xt = np.linspace(0, total_time, 1000)
RSL = np.zeros(xt.size)
RSL[:500]= -1*base_level_rise/(total_time/2)*xt[:500]
RSL[500:] =  base_level_rise/(total_time/2)*xt[500:]-2*base_level_rise
model.set_baselevel(xt, RSL)
beds = []
otime = []
rsl = []
beds.append(model.u)
otime.append(model.time)
rsl.append(model.base_level)
sns.set_palette('viridis',n_colors=int((total_time / dt)/1000) + 2)
for k in range(int(total_time / dt)):
    model.run_step()
    #     model.set_left(model.base_level+10)
    if k % 10 == 0:
        pbar.set_description("Processing year %s" % np.round(model.time, 1).astype(int))
        beds.append(model.u)
        otime.append(model.time)
        rsl.append(model.base_level)
    if k % 1000 == 0:
        plt.plot(model.u,label="year %s" % np.round(model.time, 0))
plt.plot(model.u,label="year %s" % np.round(model.time, 0))
plt.gca().set_xlabel('Distance (10^1 m)')
plt.gca().set_ylabel('Elevation (m)')
plt.gca().set_title('Constant Sea Level Rise (5 m) followed by Constant Sea Level Fall (5 m)\n with Constant Sediment Flux')
_=plt.legend(loc='best',fontsize=7)

sns.set_palette('viridis',n_colors=21)
fig=plt.figure(figsize=(15,5))
dt = .1
total_time = 2000
base_level_rise=-5
model = Diffuse1D(length=10000, spacing=10, tstep=dt, left=10, right=-20, K=2e2, var_K=False)
xt = np.linspace(0, total_time, 1000)
RSL = np.zeros(xt.size)
RSL[:500]= -1*base_level_rise/(total_time/2)*xt[:500]
RSL[500:] =  base_level_rise/(total_time/2)*xt[500:]-2*base_level_rise
model.set_baselevel(xt, RSL)
beds = []
otime = []
rsl = []
beds.append(model.u)
otime.append(model.time)
rsl.append(model.base_level)
sns.set_palette('viridis',n_colors=int((total_time / dt)/1000) + 2)
for k in range(int(total_time / dt)):
    model.run_step()
    #     model.set_left(model.base_level+10)
    if k % 10 == 0:
        pbar.set_description("Processing year %s" % np.round(model.time, 1).astype(int))
        beds.append(model.u)
        otime.append(model.time)
        rsl.append(model.base_level)
    if k % 1000 == 0:
        plt.plot(model.u,label="year %s" % np.round(model.time, 0))
plt.plot(model.u,label="year %s" % np.round(model.time, 0))
plt.gca().set_xlabel('Distance (10^1 m)')
plt.gca().set_ylabel('Elevation (m)')
plt.gca().set_title('Constant Sea Level Rise (5 m) followed by Constant Sea Level Fall (5 m)\n with Constant Sediment Flux')
_=plt.legend(loc='best',fontsize=7)

sns.set_palette('viridis',n_colors=31)
fig=plt.figure(figsize=(15,5))
dt = .1
total_time = 3000
base_level_rise=-5
model = Diffuse1D(length=10000, spacing=10, tstep=dt, left=10, right=-20, K=2e2, var_K=False)
xt = np.linspace(0, total_time, 1500)
RSL = np.zeros(xt.size)
RSL[:500]= -1*base_level_rise/(total_time/3)*xt[:500]
RSL[500:1000] =  1*base_level_rise/(total_time/3)*xt[:500]+5
RSL[1000:] =  -1*base_level_rise/(total_time/3)*xt[:500]
model.set_baselevel(xt, RSL)
beds = []
otime = []
rsl = []
beds.append(model.u)
otime.append(model.time)
rsl.append(model.base_level)
for k in range(int(total_time / dt)):
    model.run_step()
    #     model.set_left(model.base_level+10)
    if k % 10 == 0:
        pbar.set_description("Processing year %s" % np.round(model.time, 1).astype(int))
        beds.append(model.u)
        otime.append(model.time)
        rsl.append(model.base_level)
    if k % 1000 == 0:
        plt.plot(model.u,label="year %s" % np.round(model.time, 0))
plt.plot(model.u,label="year %s" % np.round(model.time, 0))
plt.gca().set_xlabel('Distance (10^1 m)')
plt.gca().set_ylabel('Elevation (m)')
plt.gca().set_title('Rise (5 m) Fall (5 m) Rise (5m) \n with Constant Sediment Flux')
_=plt.legend(loc='best',fontsize=7)

skip_frame=25
plot_beds(beds=beds[::skip_frame],otime=otime[::skip_frame],rsl=rsl[::skip_frame],aspect=10, ymin=-20, color=False)
plt.gca().set_ylim(-15,7)
plt.gca().set_xlim(200,800)
(200.0, 800.0)

- Which beds represent the highest sea level?
- What is the magnitude of sea level change?
- Can you draw the coastline change over time?
skip_frame=50
animate_beds(beds=beds2[::skip_frame],otime=otime2[::skip_frame],rsl=rsl2[::skip_frame],aspect=10, ymin=-20)

- What is the magnitude of sea level change?
- Can you draw the coastline change over time?
plt.plot(xt, np.array(RSL).ravel()+10/xt[-1]*xt-5,lw=3)
plt.gca().set_xlabel('Years')
plt.gca().set_ylabel('Sea Level')
sns.despine()

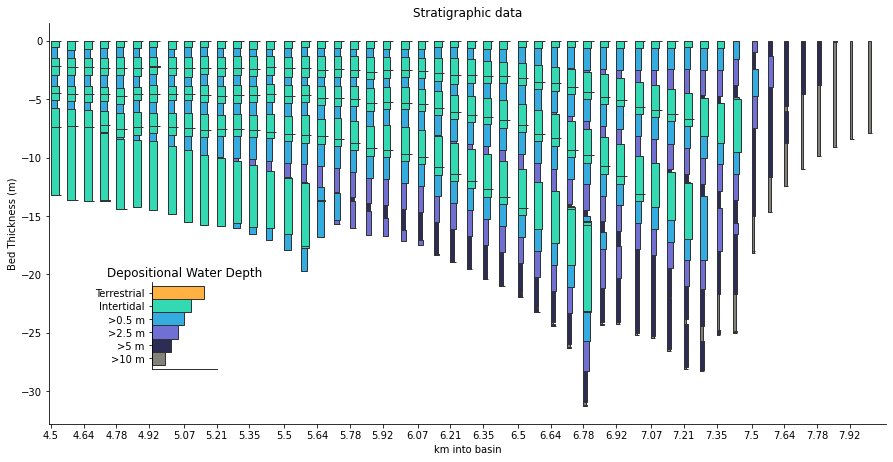
Stratigraphic Sections
Below I have extracted a sedimentary column from the model run above. The beds are colored by the water depth they were deposited in (brighter/wider corresponds to shallower water.
Draw your best guess interpretation for sea level change.
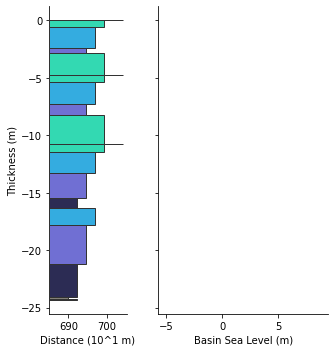
Stratigraphic Sections
Below I have extracted a sedimentary column from the model run above. The beds are colored by the water depth they were deposited in (brighter/wider corresponds to shallower water).
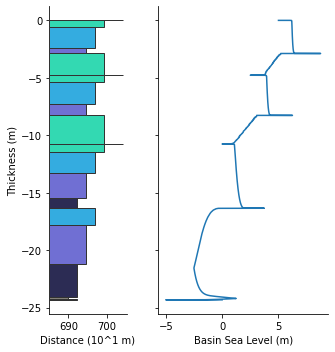
How did you do? What is happening?