Lecture 5: Hot spots and seamounts
The topography and geology of the seafloor offers some of the only clues we have to understanding the hidden workings of the mantle below. We have discussed some of the largest features of ocean basins, and today we consider the small seamounts and their critical role in this story.
- Models of mantle convection and implications for volcanic islands
- Plumes and hotspots
- Free air anomalies and the swell
- Explaining swells (thick crust vs thin lithospheric mantle)
We acknowledge and respect the lək̓ʷəŋən peoples on whose traditional territory the university stands and the Songhees, Esquimalt and W̱SÁNEĆ peoples whose historical relationships with the land continue to this day.
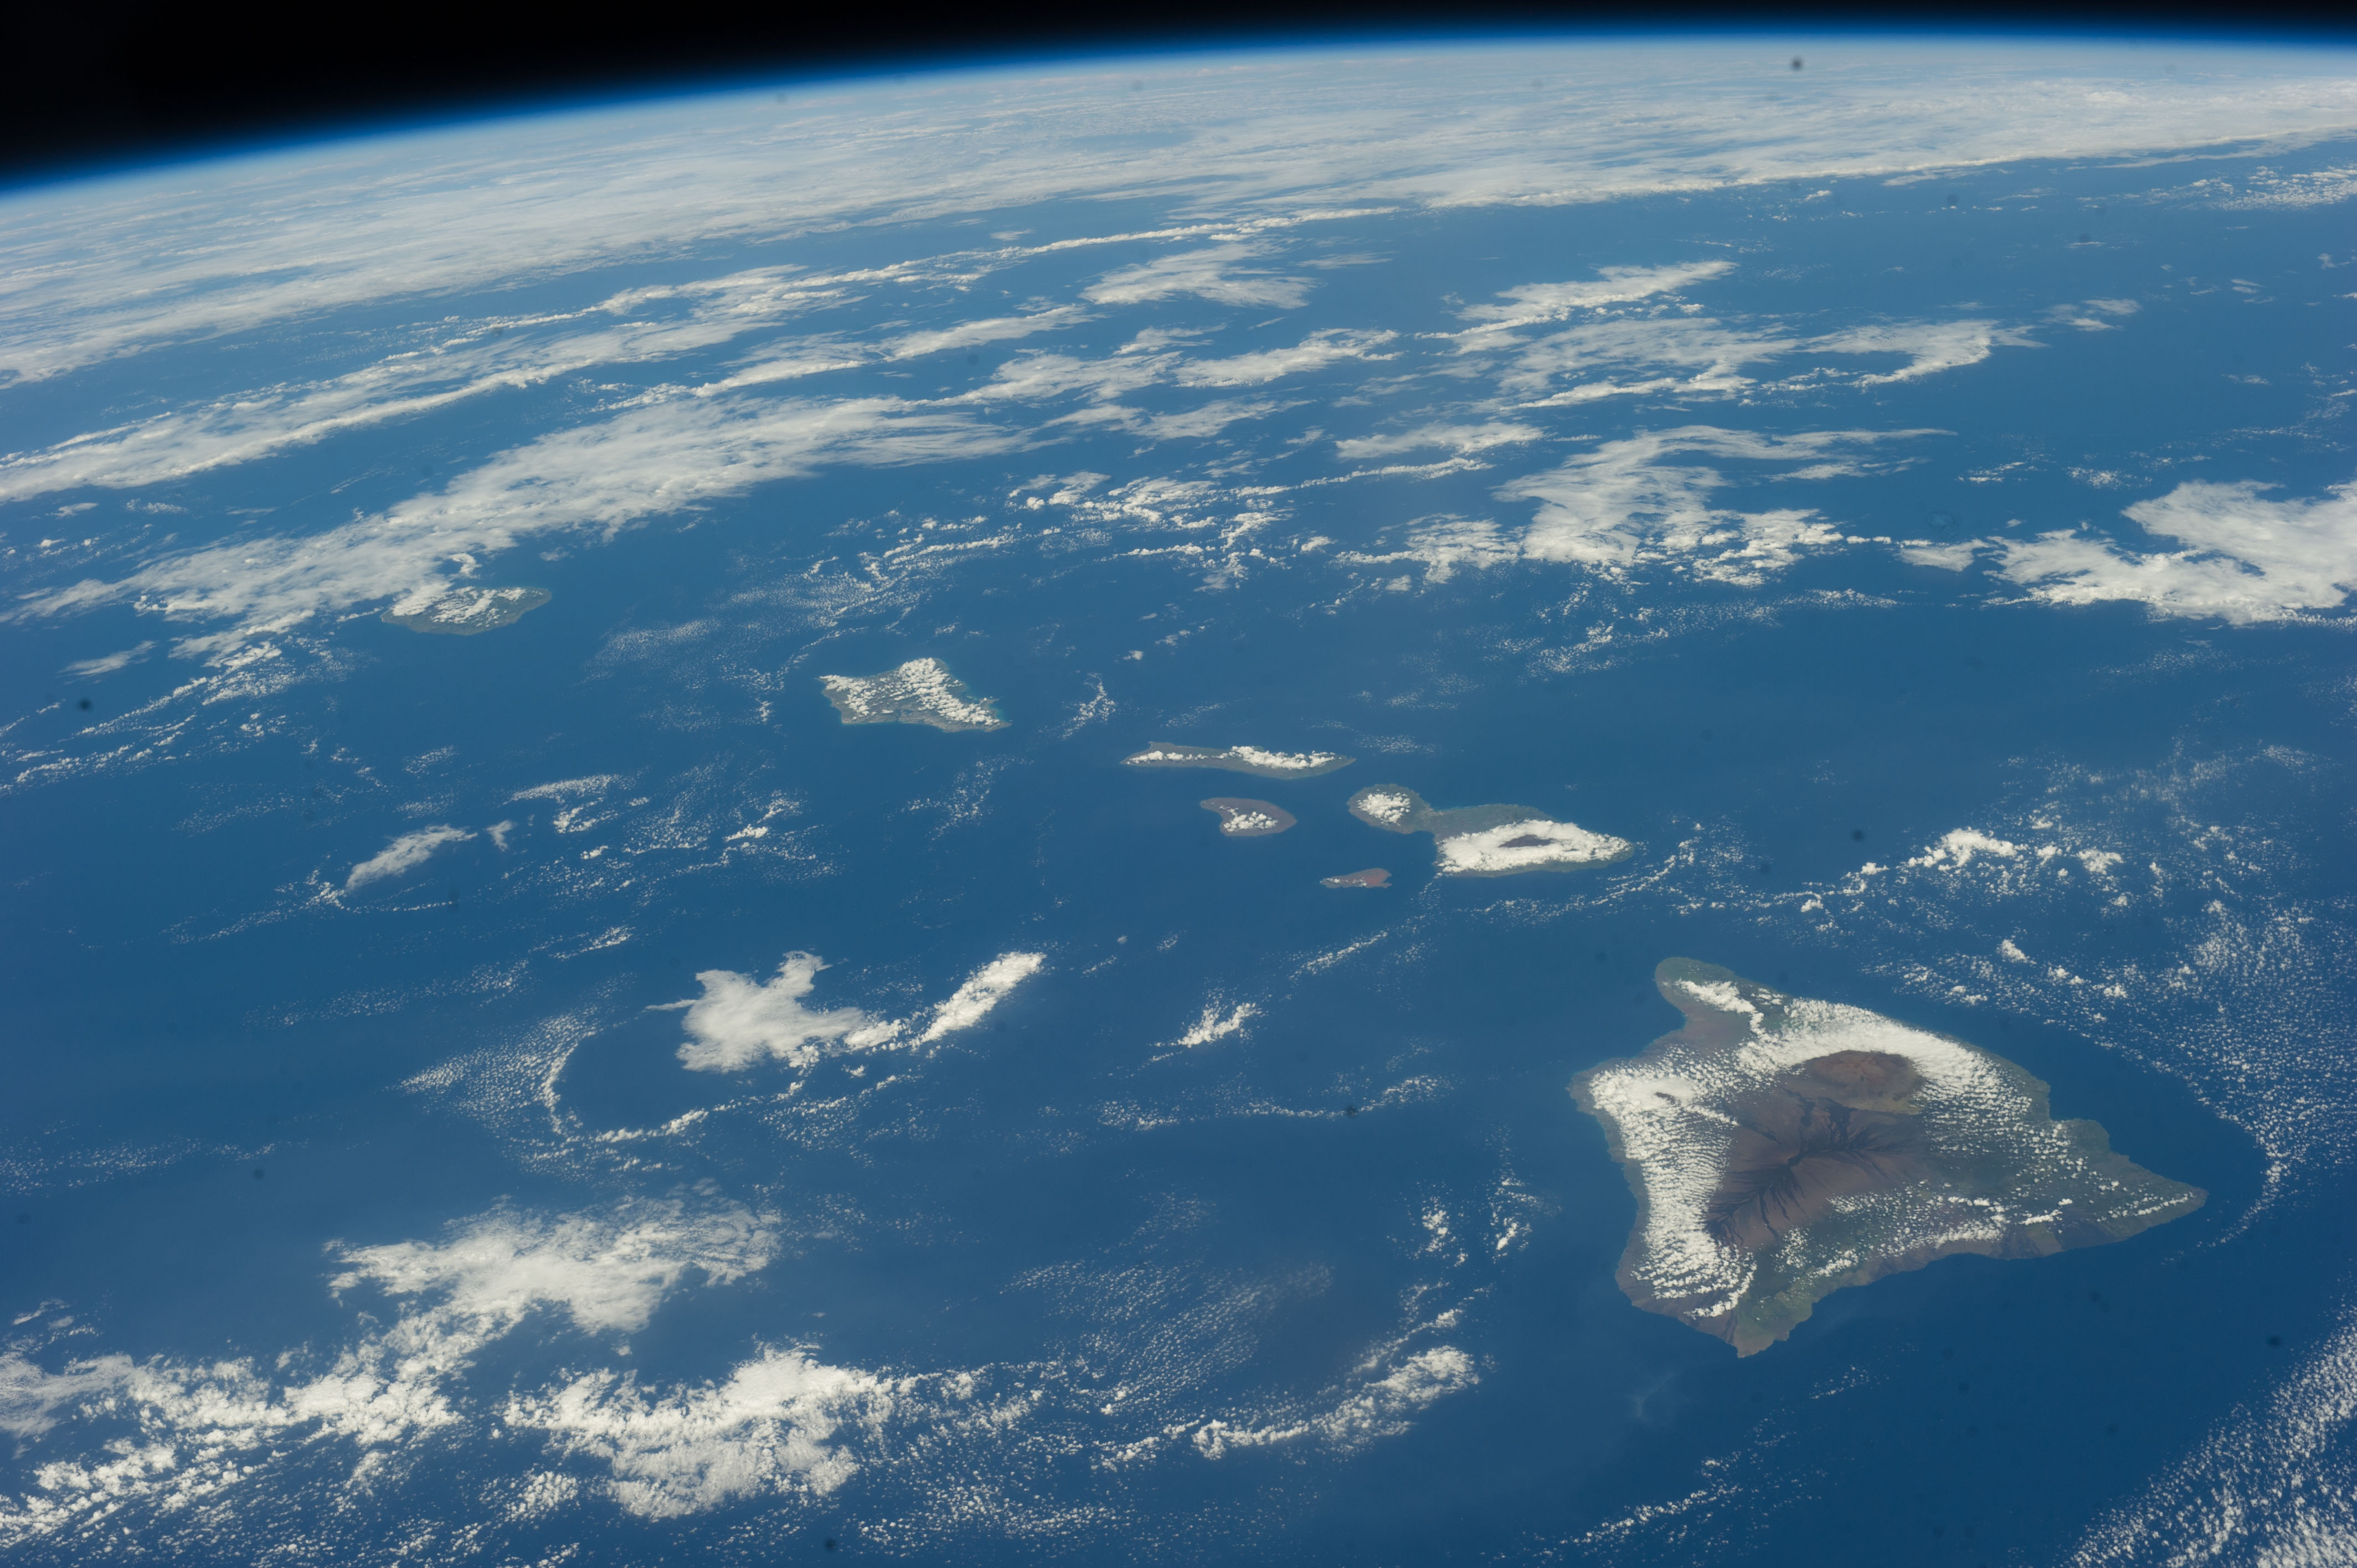
Features of the seafloor
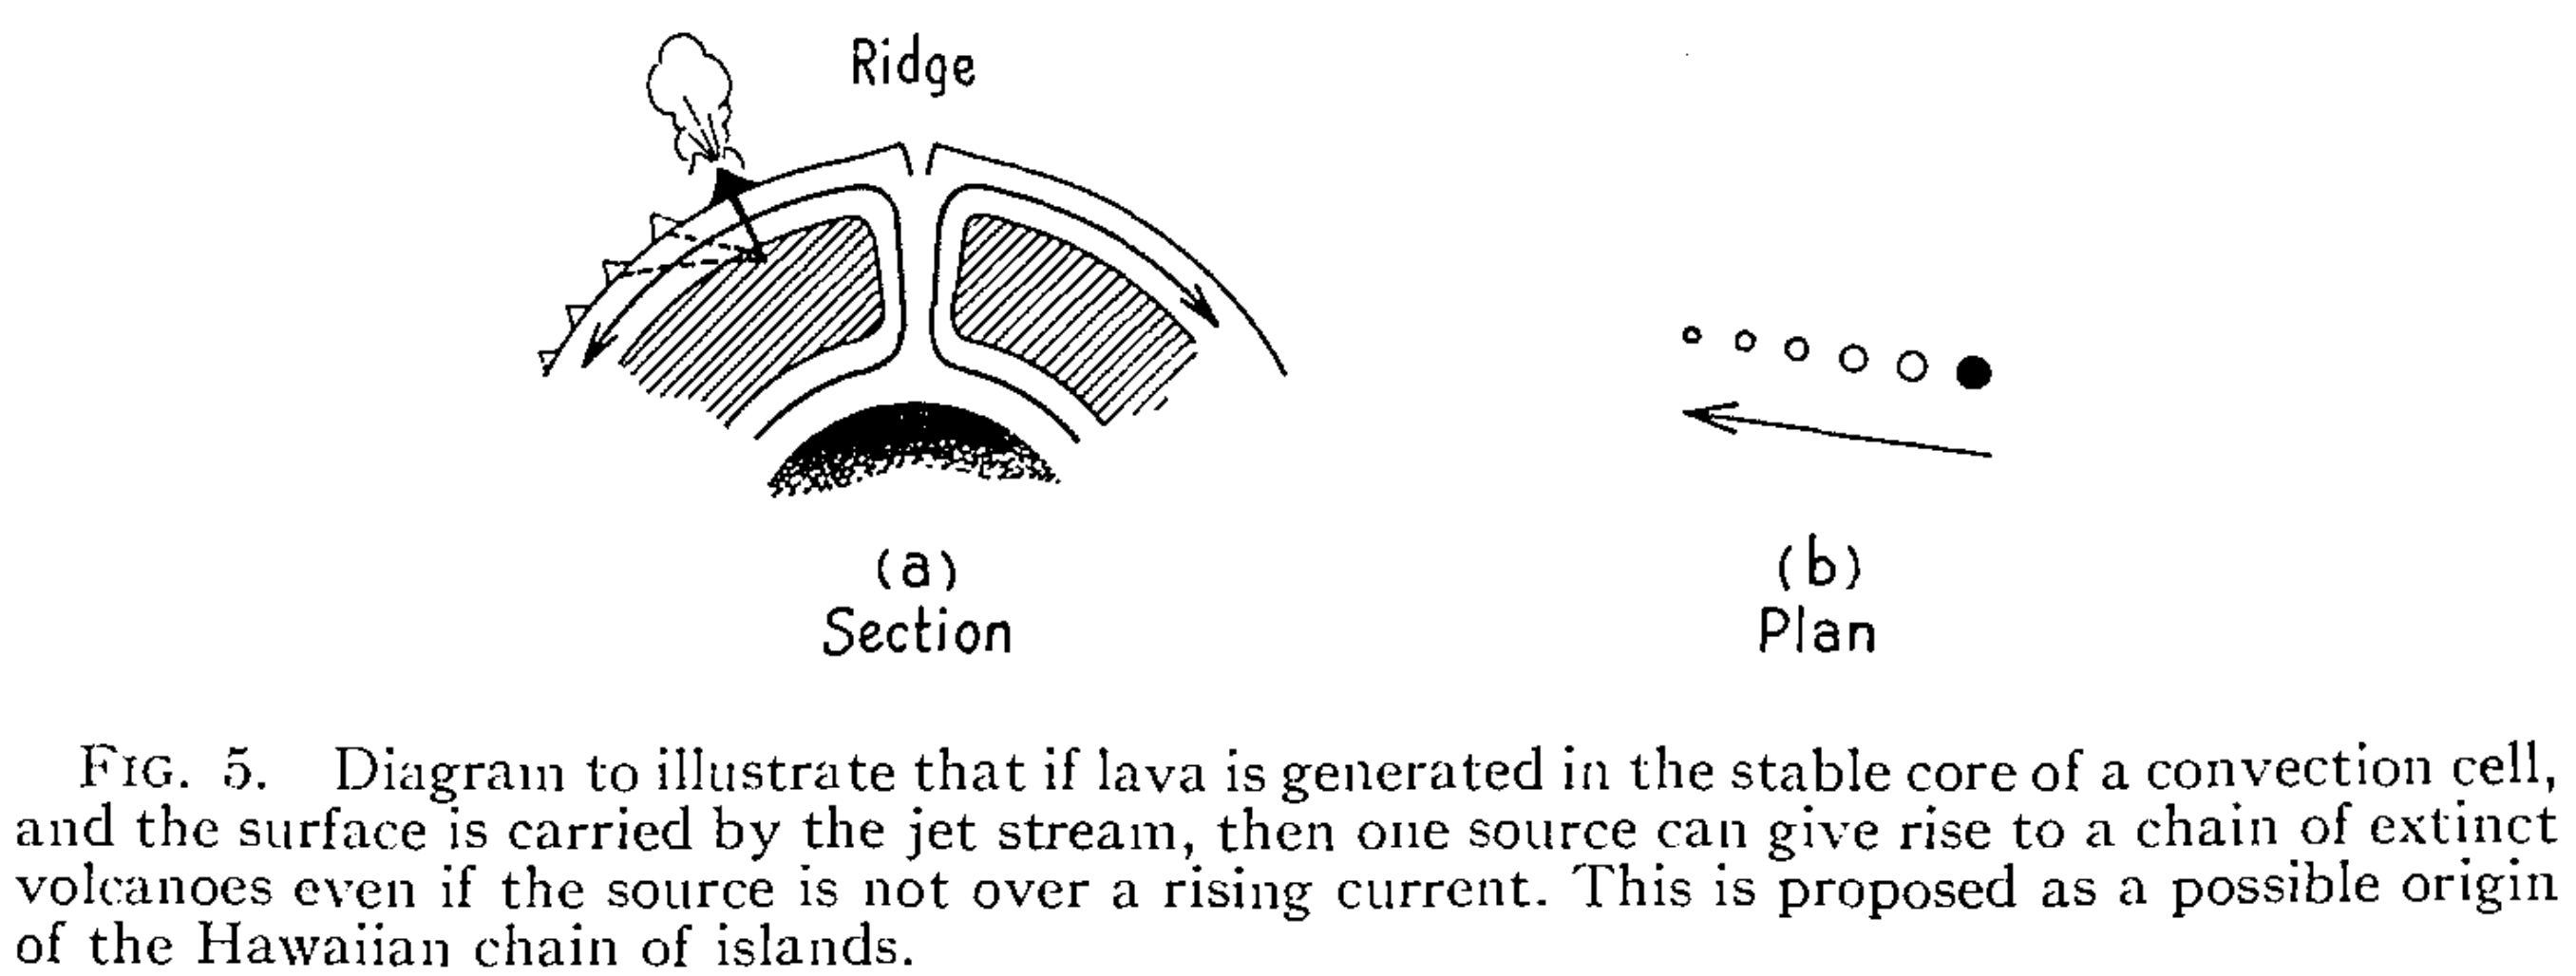
A possible origin of the Hawaiian Islands (Tuzo Wilson, 1963)
"It is less obvious why a stream of volcanoes should arise like a
series of bubbles from a point beneath the island of Hawaii which is far from
the rising current."
Tuzo Wilson, A possible origin of the Hawaiian Islands, 1963
Possible convective models
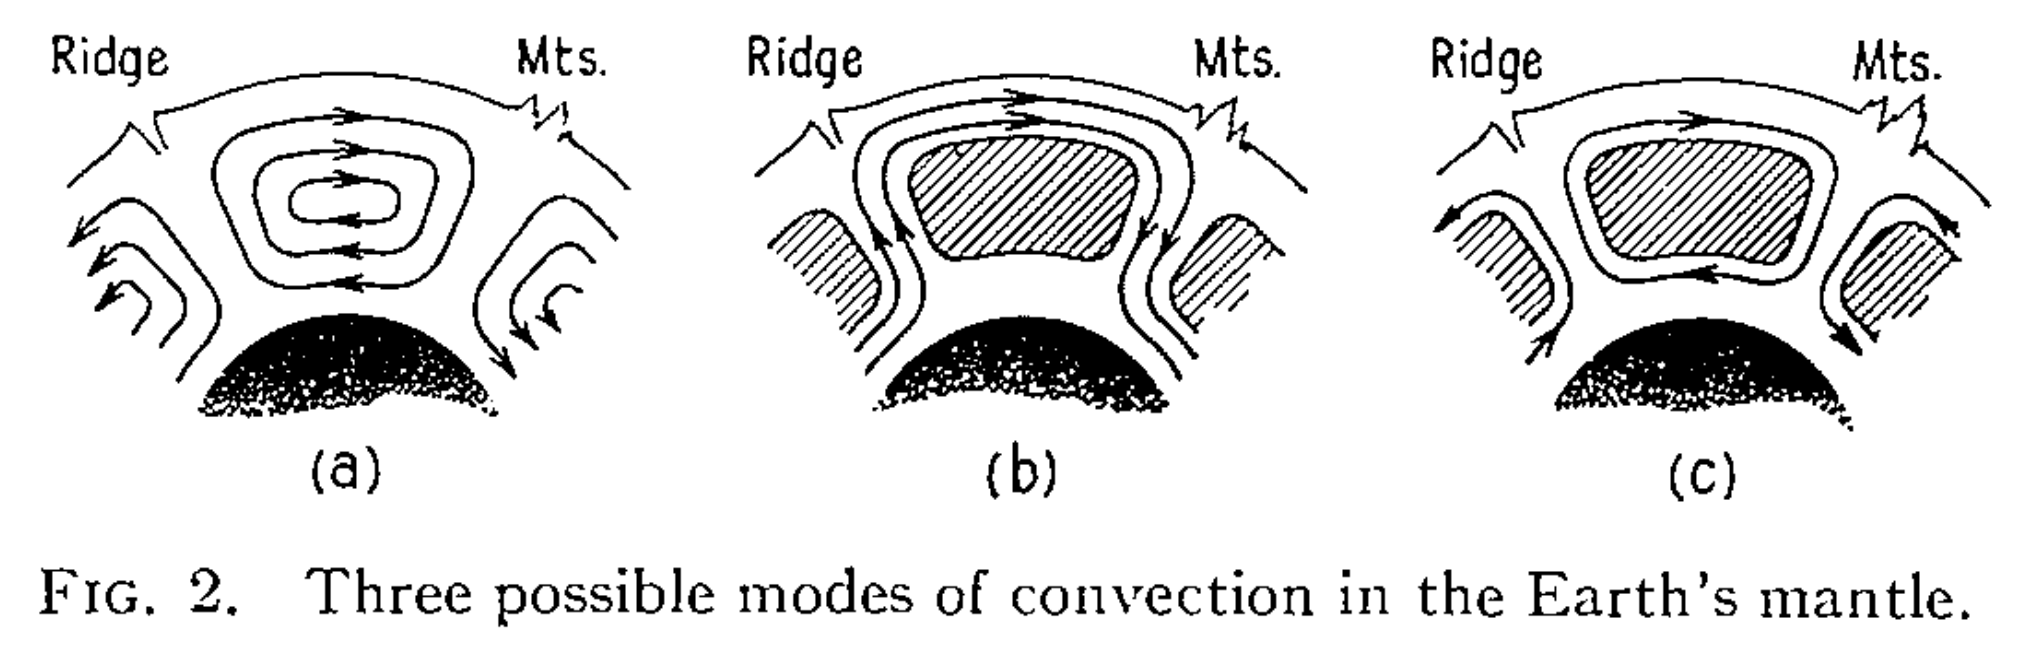
The volcanic consequences of each convective model
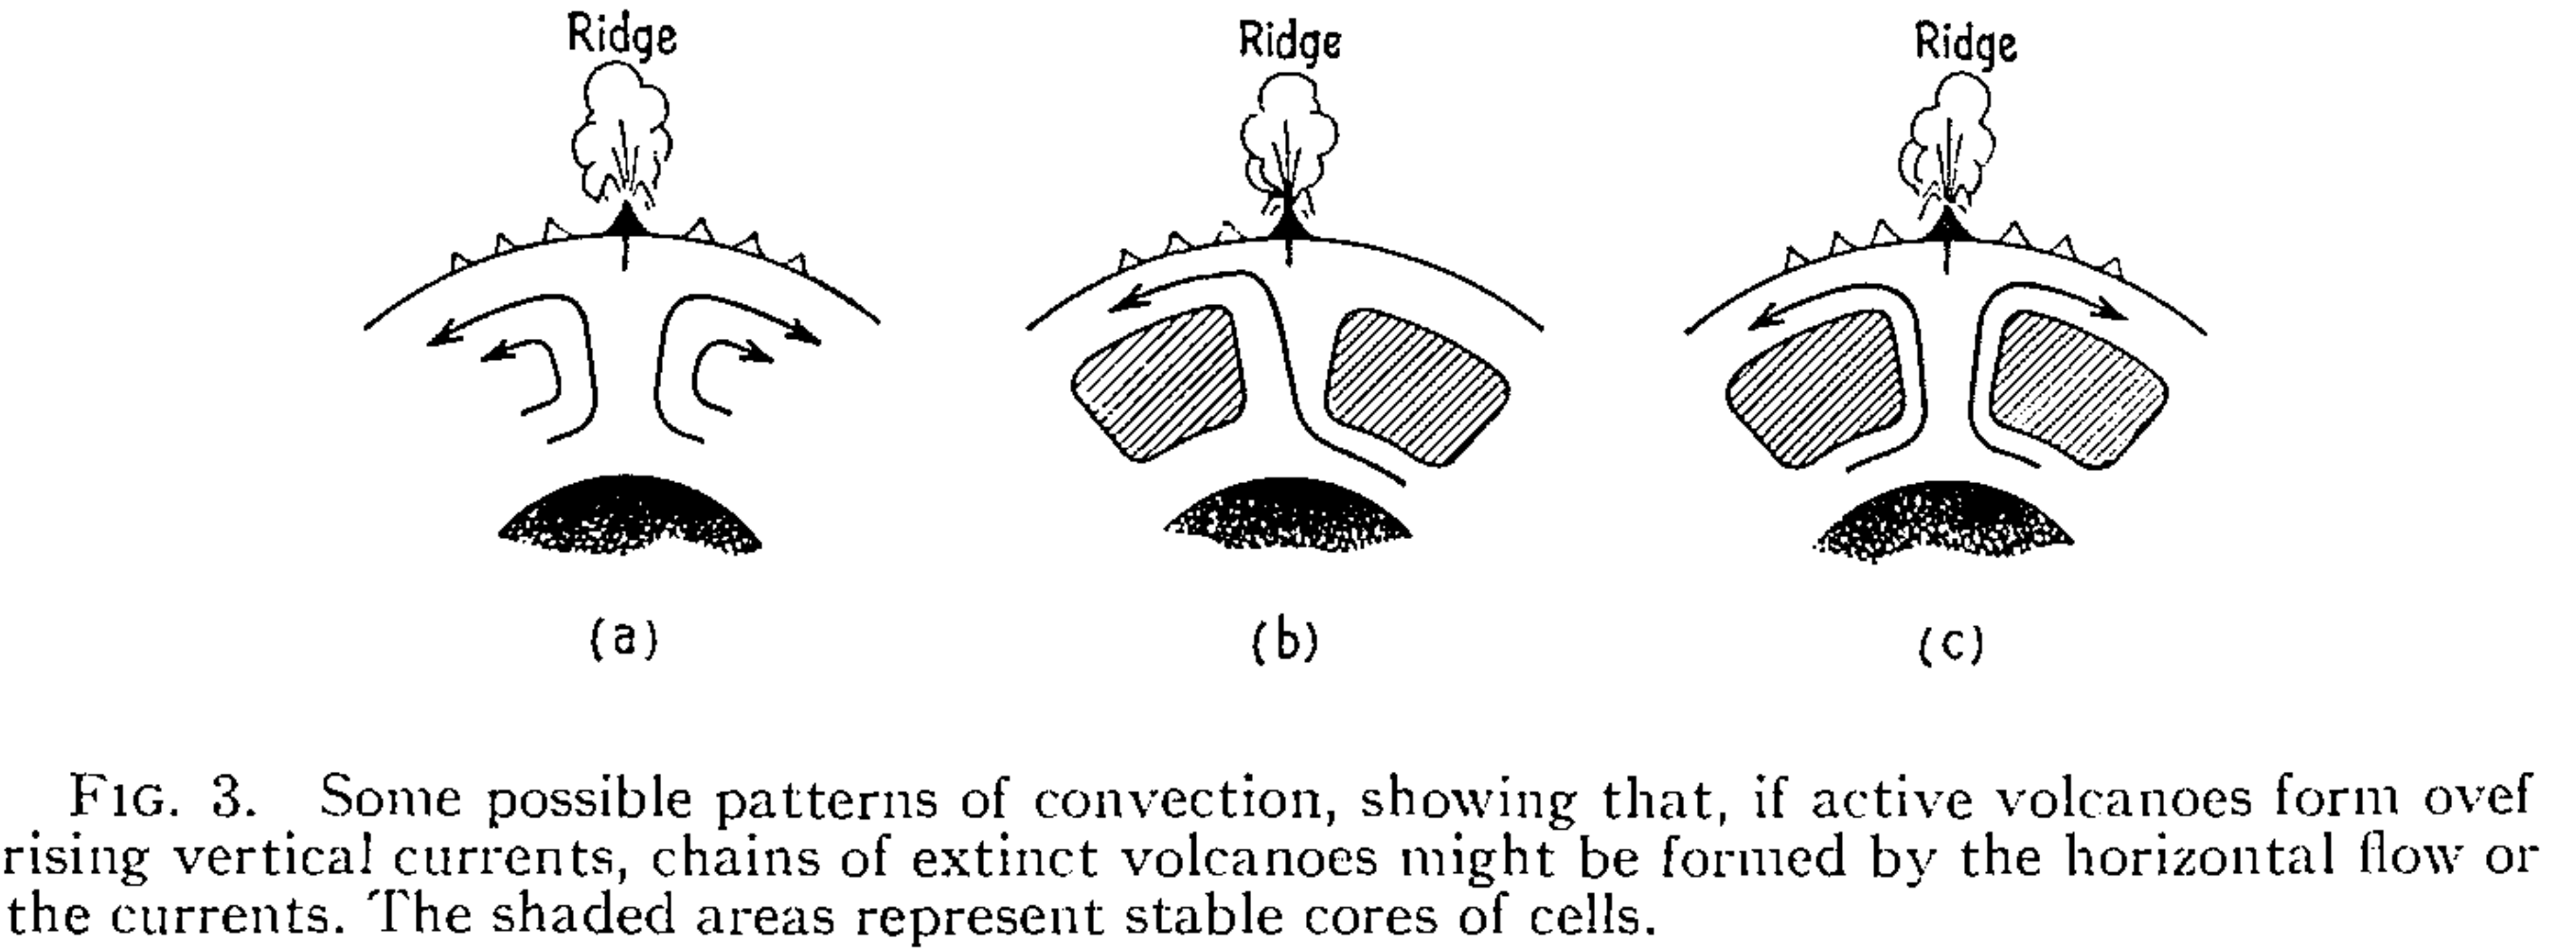
The volcanic consequences of each convective model
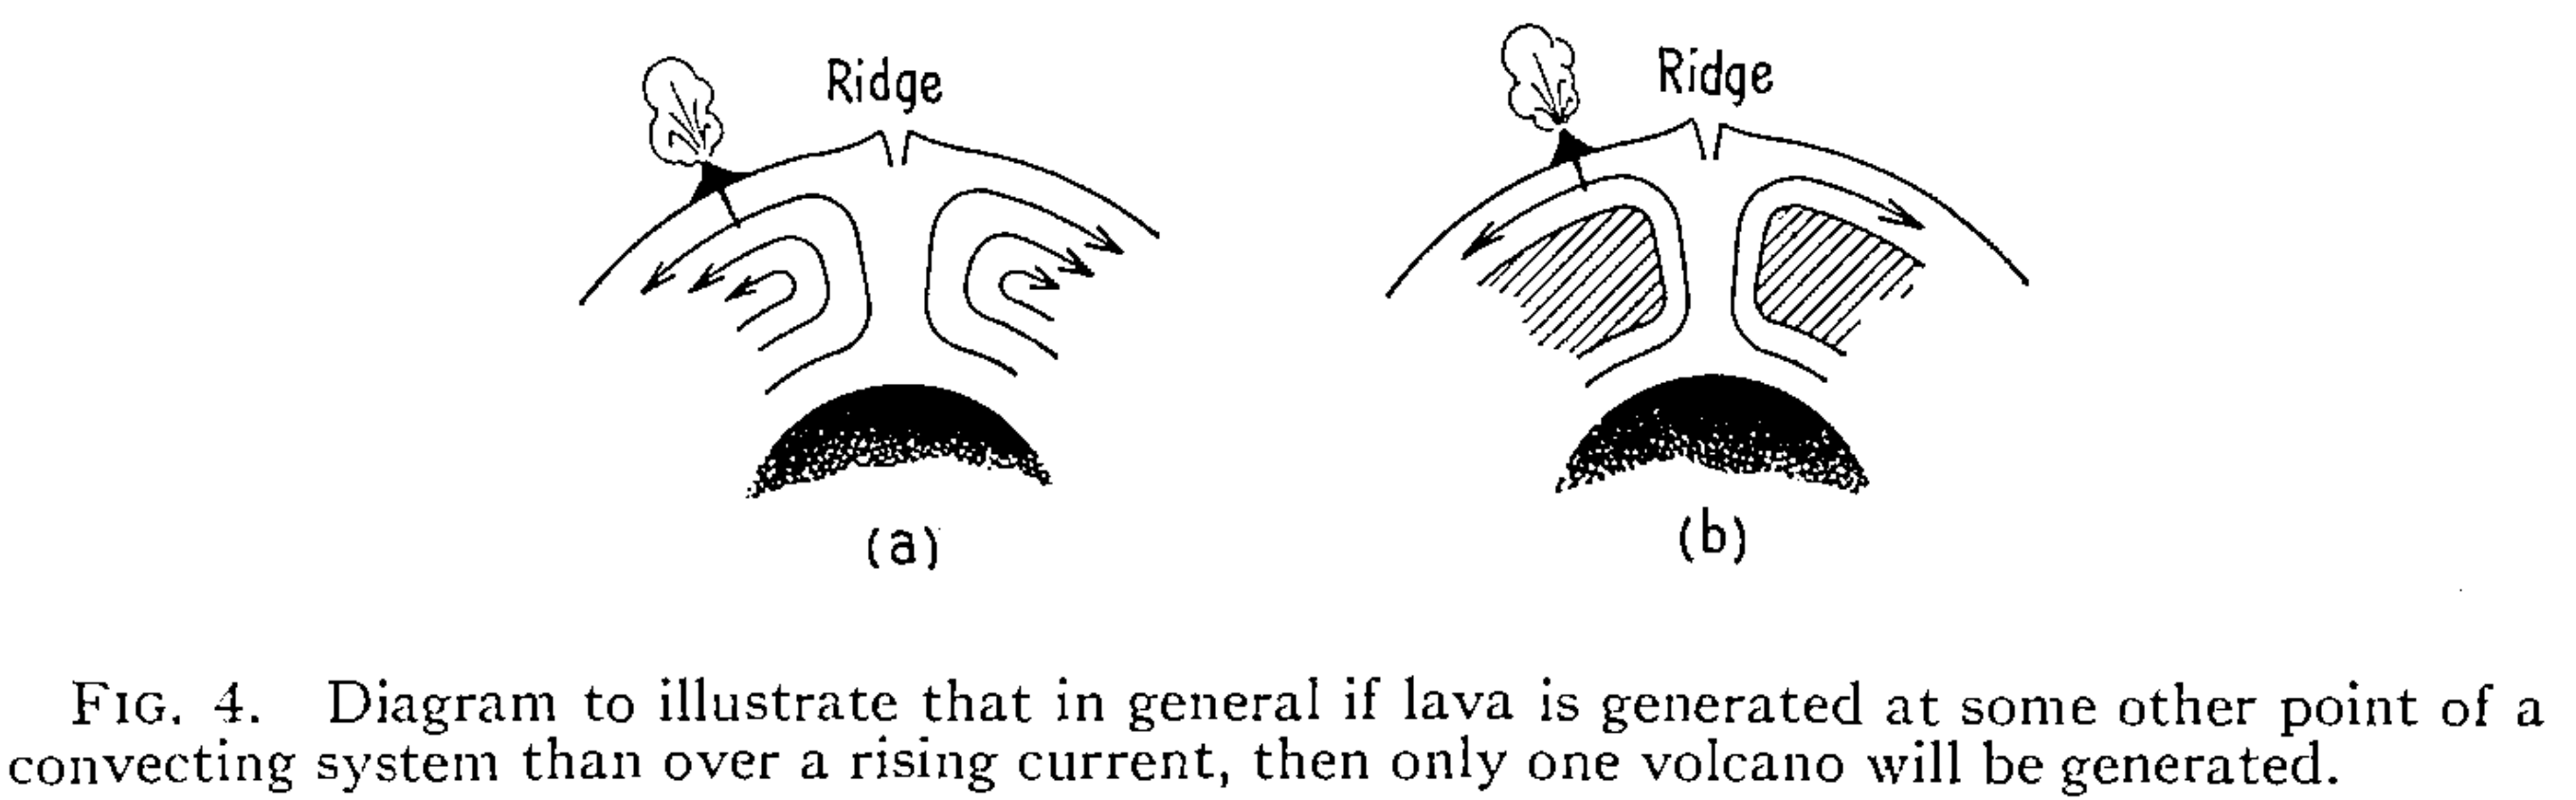
The source of lavas must be deep
The plume
"In my model there are about twenty deep mantle plumes bringing heat and relatively primordial material up to the asthenosphere and horizontal currents in the asthenosphere flow radially away from each of these plumes..... This model is compatible with the observation that there is a
difference between oceanic island and oceanic ridge basalts."
Jason Morgan, Convection Plumes in the Lower Mantle, 1971
The ages of "rising bubbles"
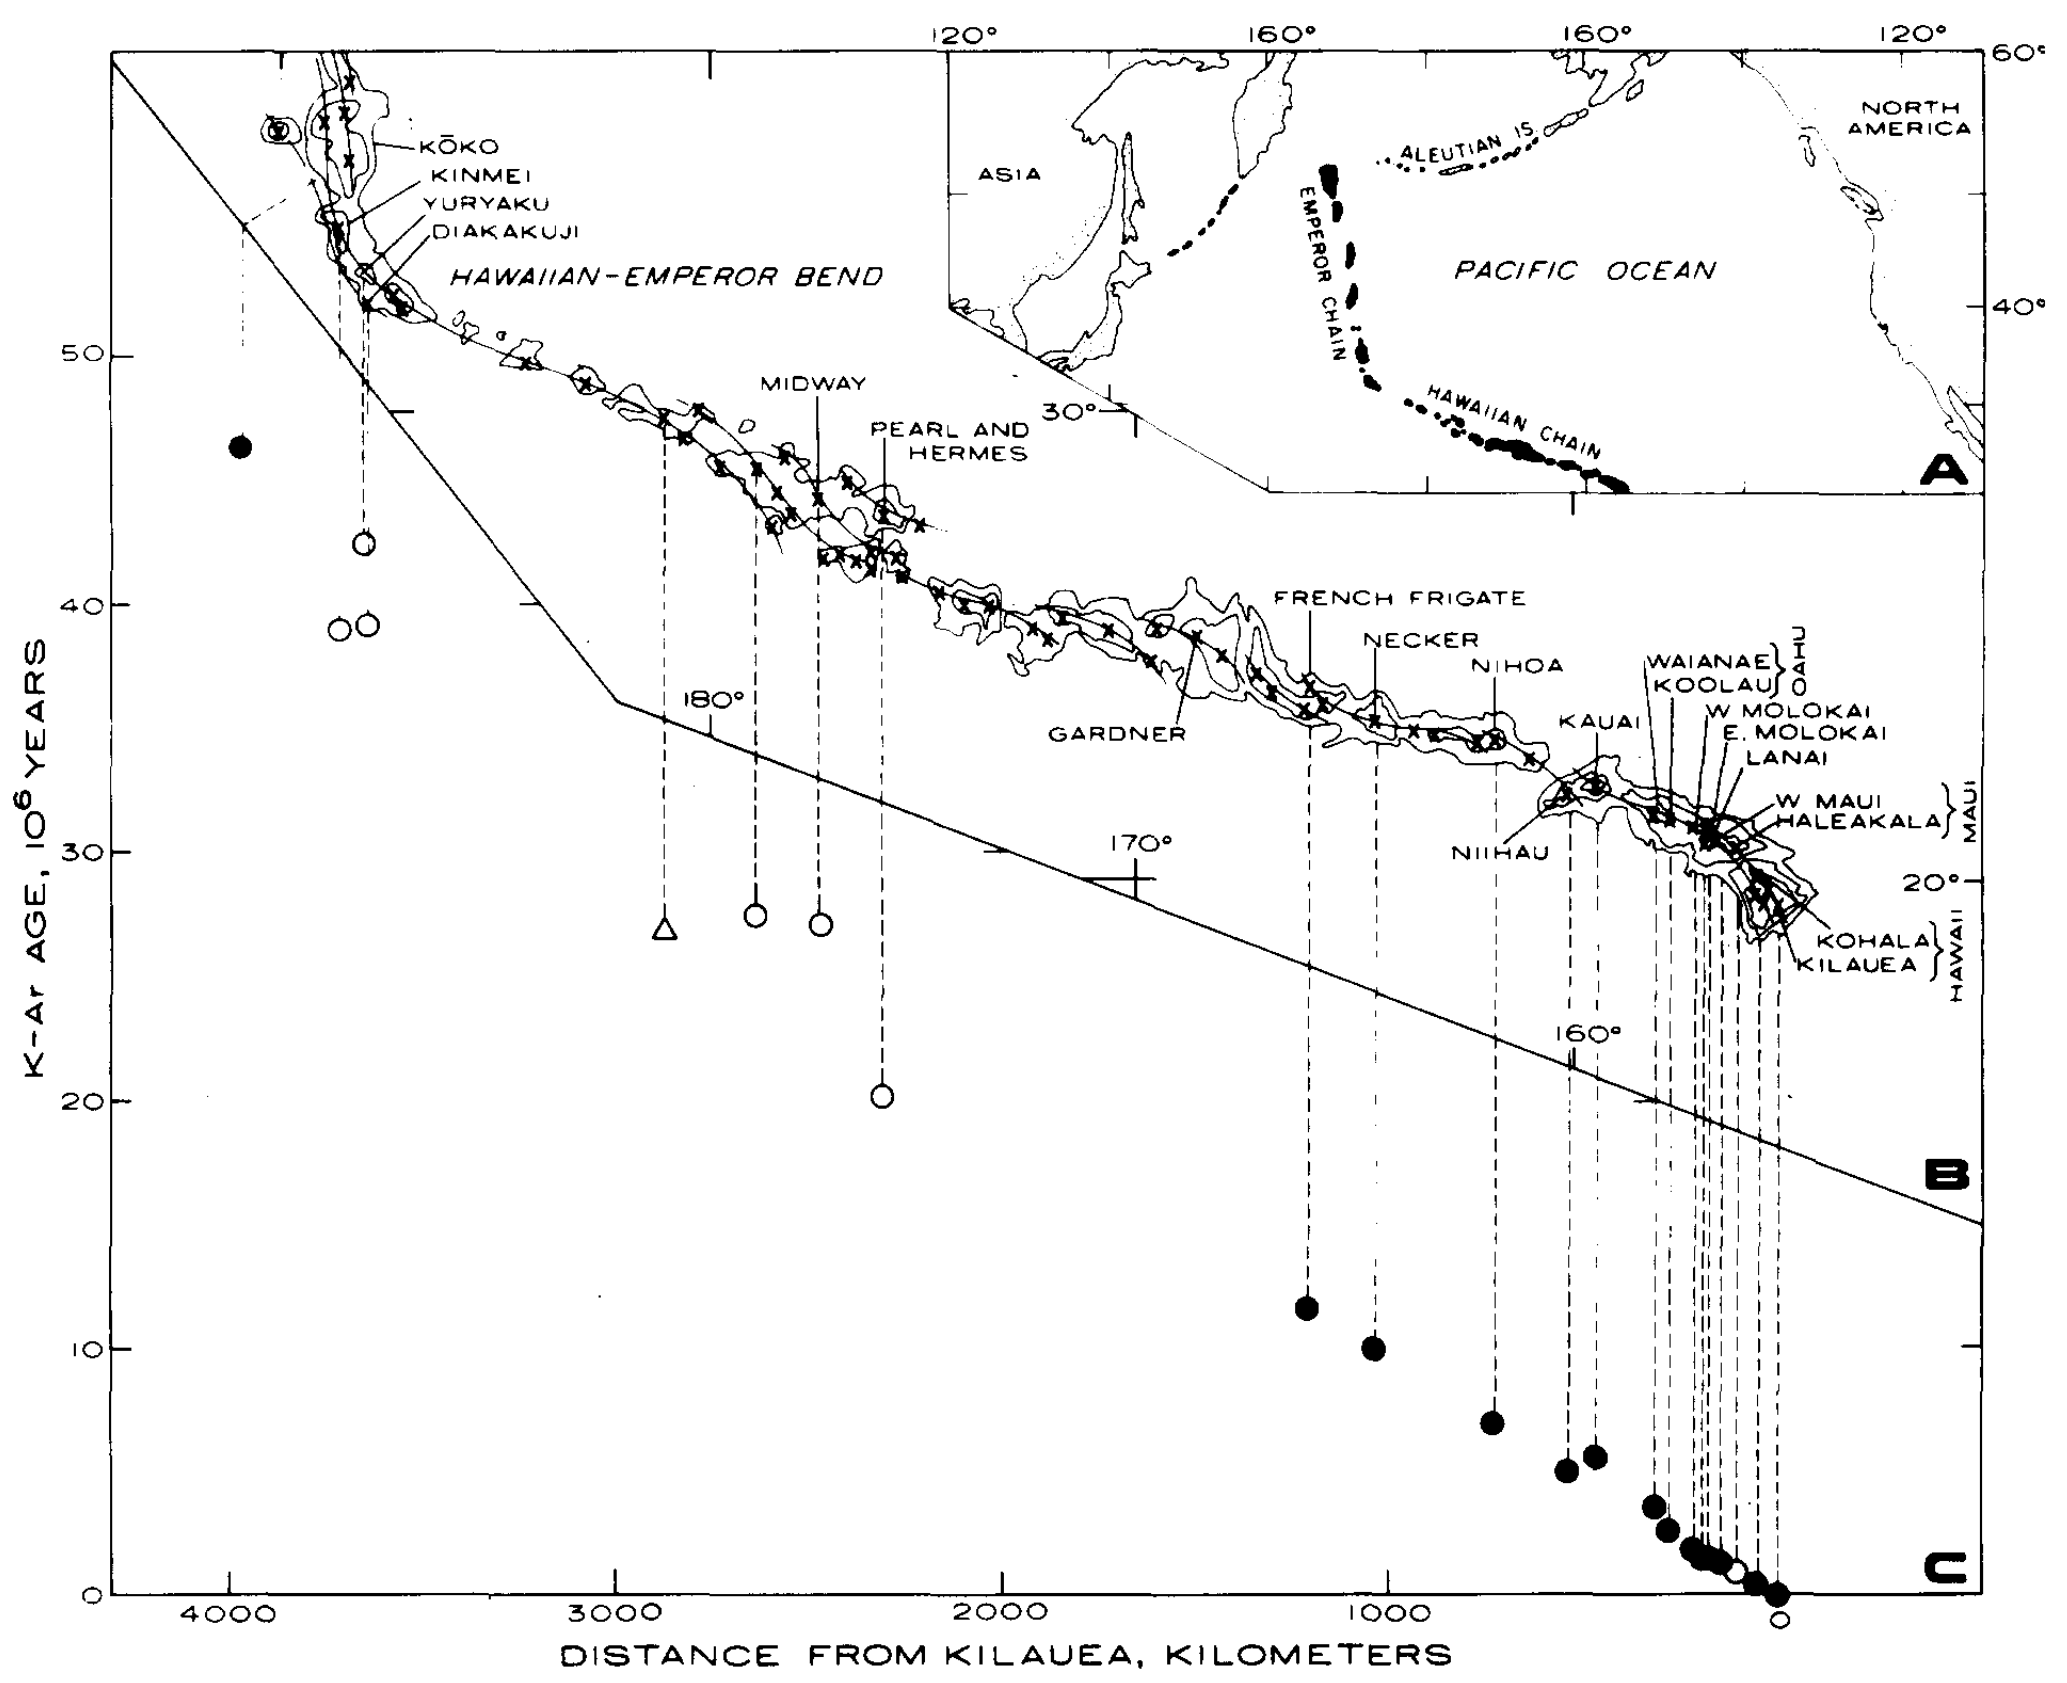
K-Ar ages from Hawaii chain volcanoes (Dalrymple et. al. 1977)
More gravity..
Gravity measurements are small variations in the acceleration due to gravity (similar to the worked problem you did from last lecture). How do we actually make these measurements?
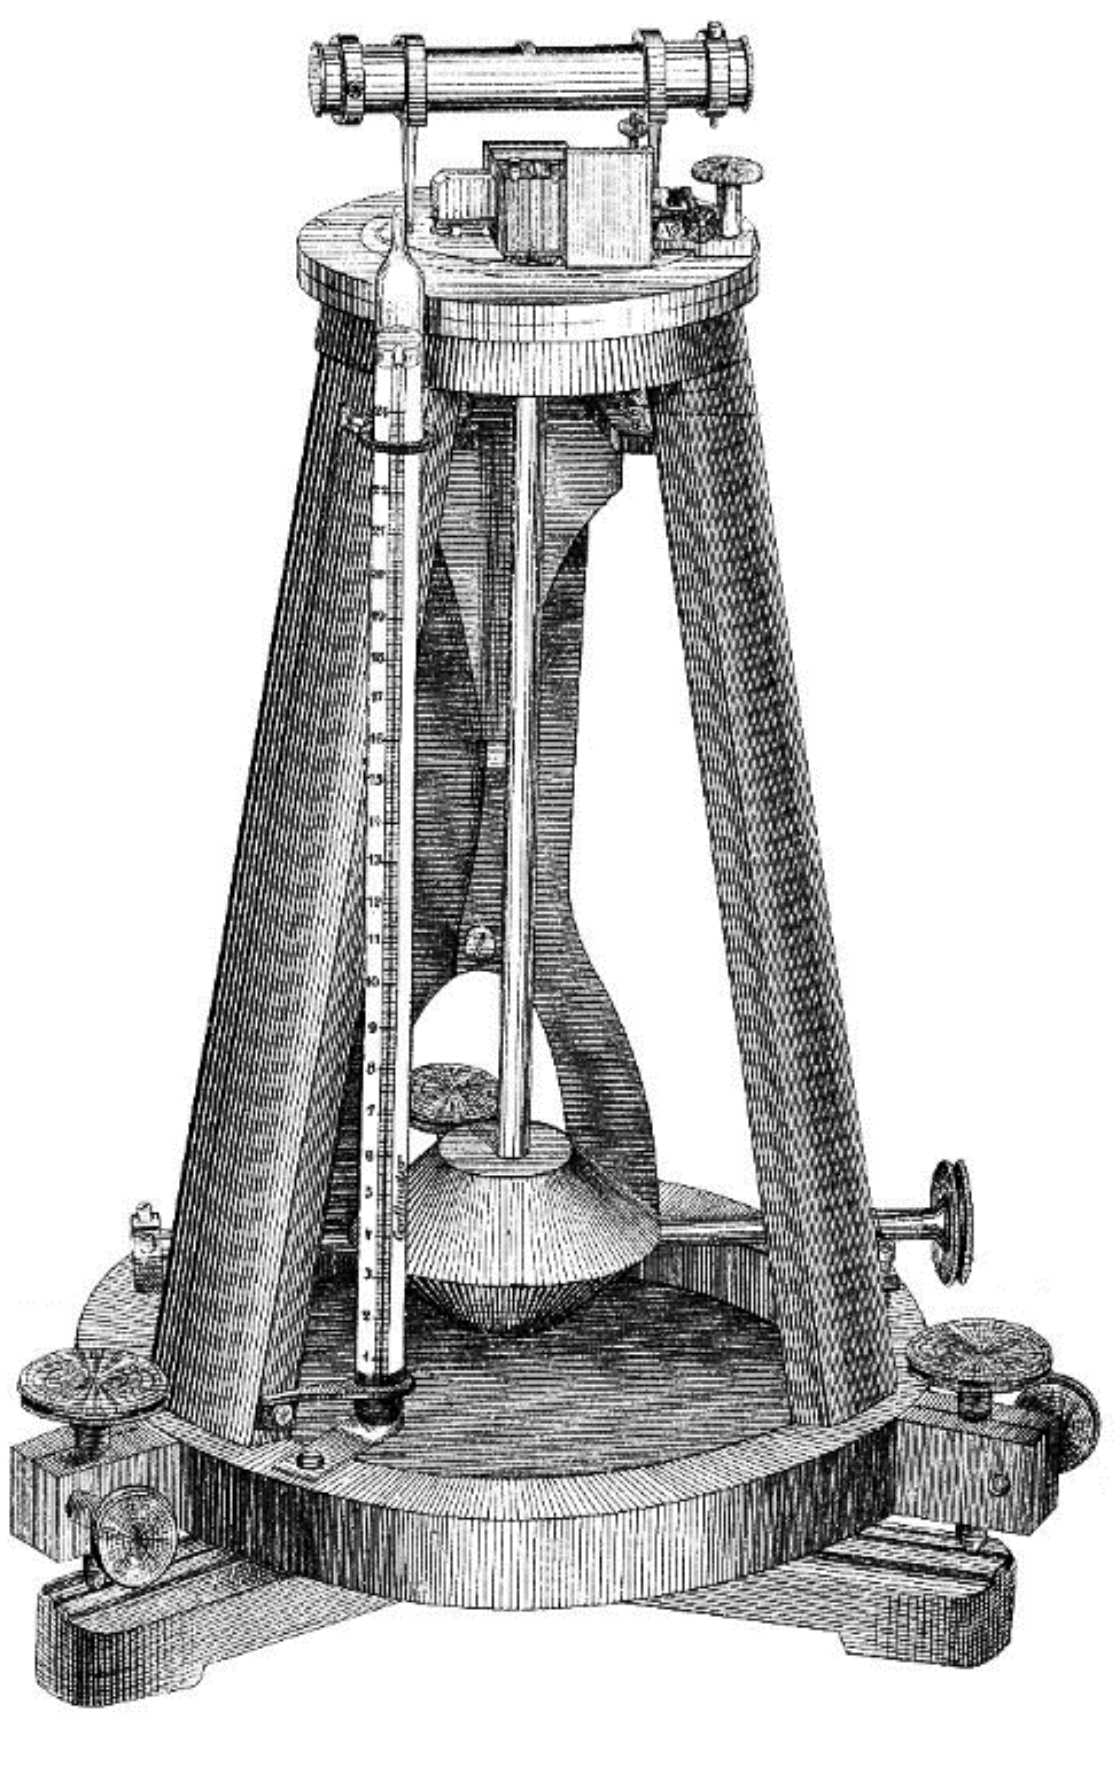 Pendulum of Sterneck 1887
The equation of simple harmonic motion, $T=2\pi\sqrt{\frac{L}{g}}$, describes the relationship between an easily measured property (T, the period of the oscillation) to gravity, g.
Energy is added to the pendulum in a controlled way to compensate for friction.
Energy is added to the pendulum in a controlled way to compensate for friction.
More gravity..
Gravity measurements are small variations in the acceleration due to gravity (similar to the worked problem you did from last lecture). How do we actually make these measurements?
Pendulum of Sterneck 1887
The equation of simple harmonic motion, $T=2\pi\sqrt{\frac{L}{g}}$, describes the relationship between an easily measured property (T, the period of the oscillation) to gravity, g.
Energy is added to the pendulum in a controlled way to compensate for friction.
We keep talking about gravity measured over the ocean.. how were these measurements made on a ship?
Energy is added to the pendulum in a controlled way to compensate for friction.
We keep talking about gravity measured over the ocean.. how were these measurements made on a ship?
More gravity..
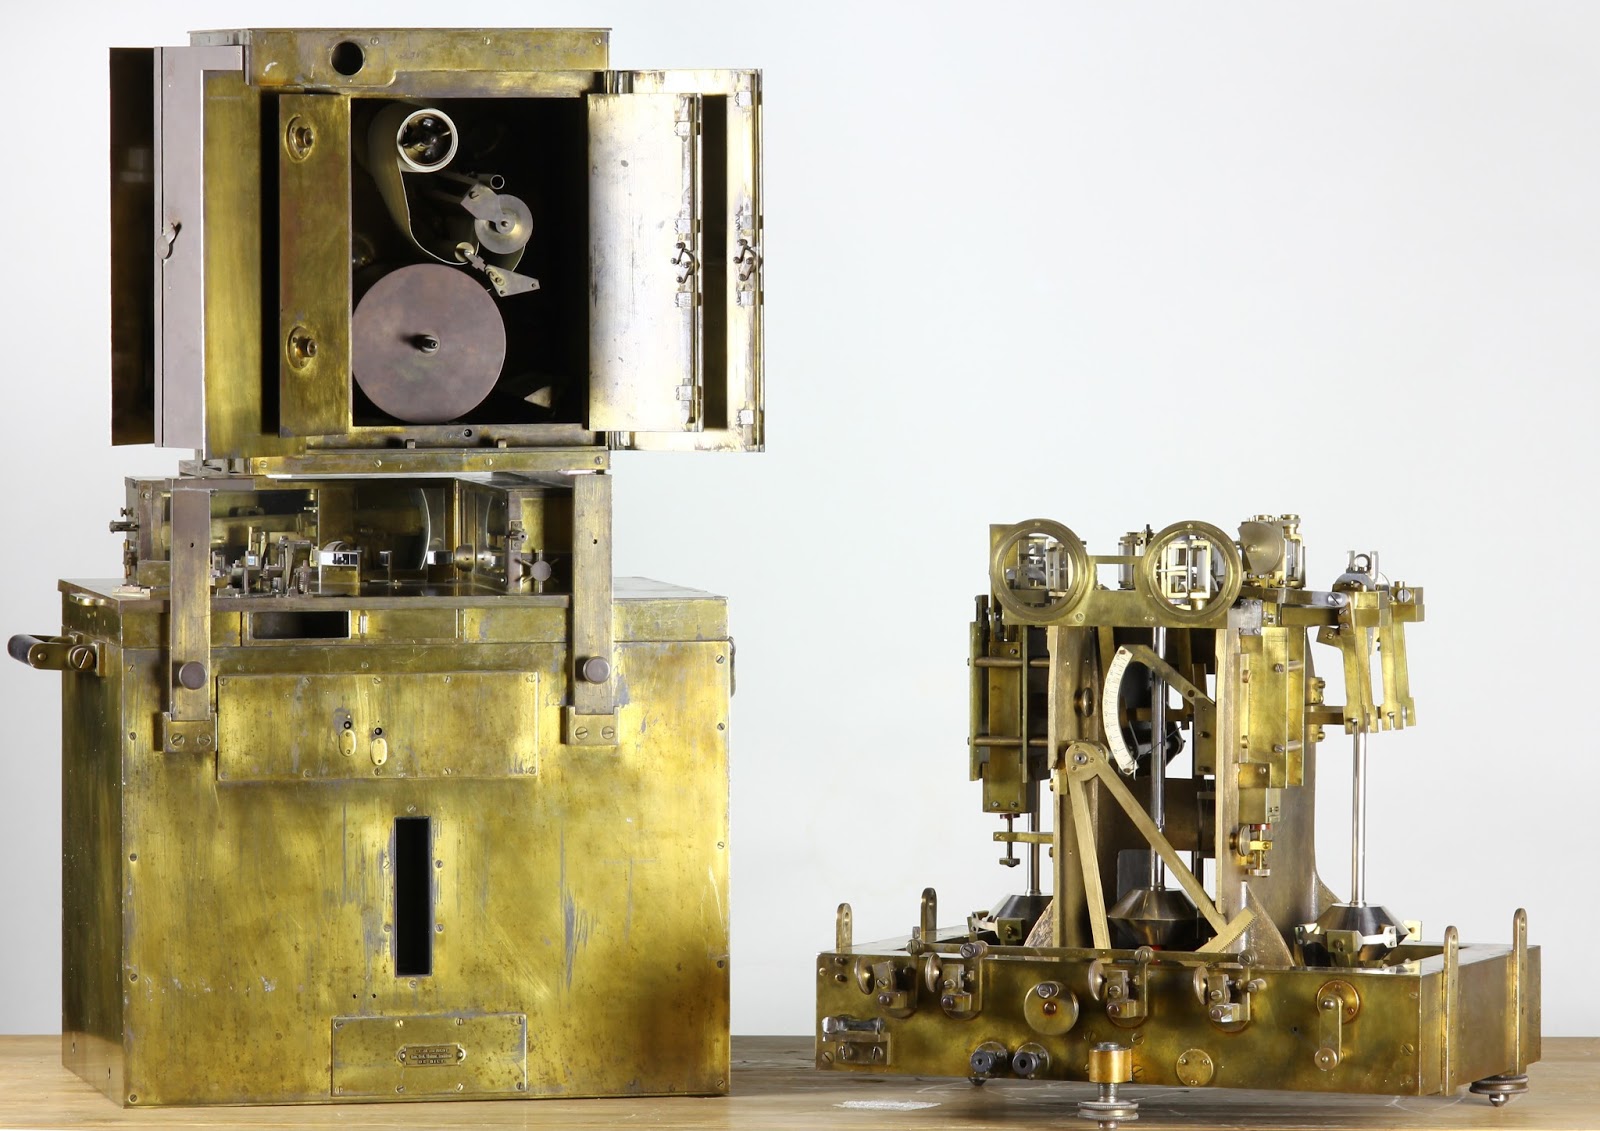 Shipboard gravimeter built in 1923
The equation of simple harmonic motion, $T=2\pi\sqrt{\frac{L}{g}}$, describes the relationship between an easily measured property (T, the period of the oscillation) to gravity, g.
Shipboard accelerations are certainly not simple harmonic motion, however...
By precisely measuring the deflection angle between pairs of pendulums, gravity can be constrained even under additional accelerations. A set of only three pendulums are needed to account for ship motions.
Shipboard accelerations are certainly not simple harmonic motion, however...
By precisely measuring the deflection angle between pairs of pendulums, gravity can be constrained even under additional accelerations. A set of only three pendulums are needed to account for ship motions.
More gravity..
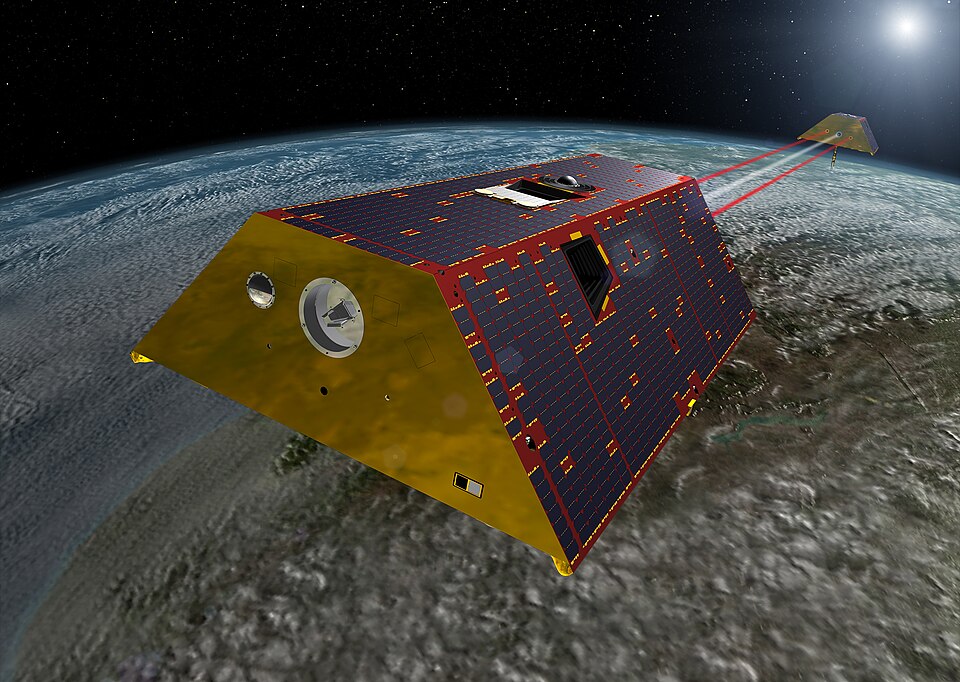 Illustration of the twin GRACE satellites
Today, we mostly measure gravity using satellites. The GRACE (Gravity Recovery and Climate Experiment) mission launched in 2002 and follow up missions using a similar approach are ongoing and planned for the future. These satellites measure gravity up to 1000 times more accurately than pendulums and have been really important for observing gravity change on the Earth's surface due to groundwater loss or ice sheet decay.
More gravity..
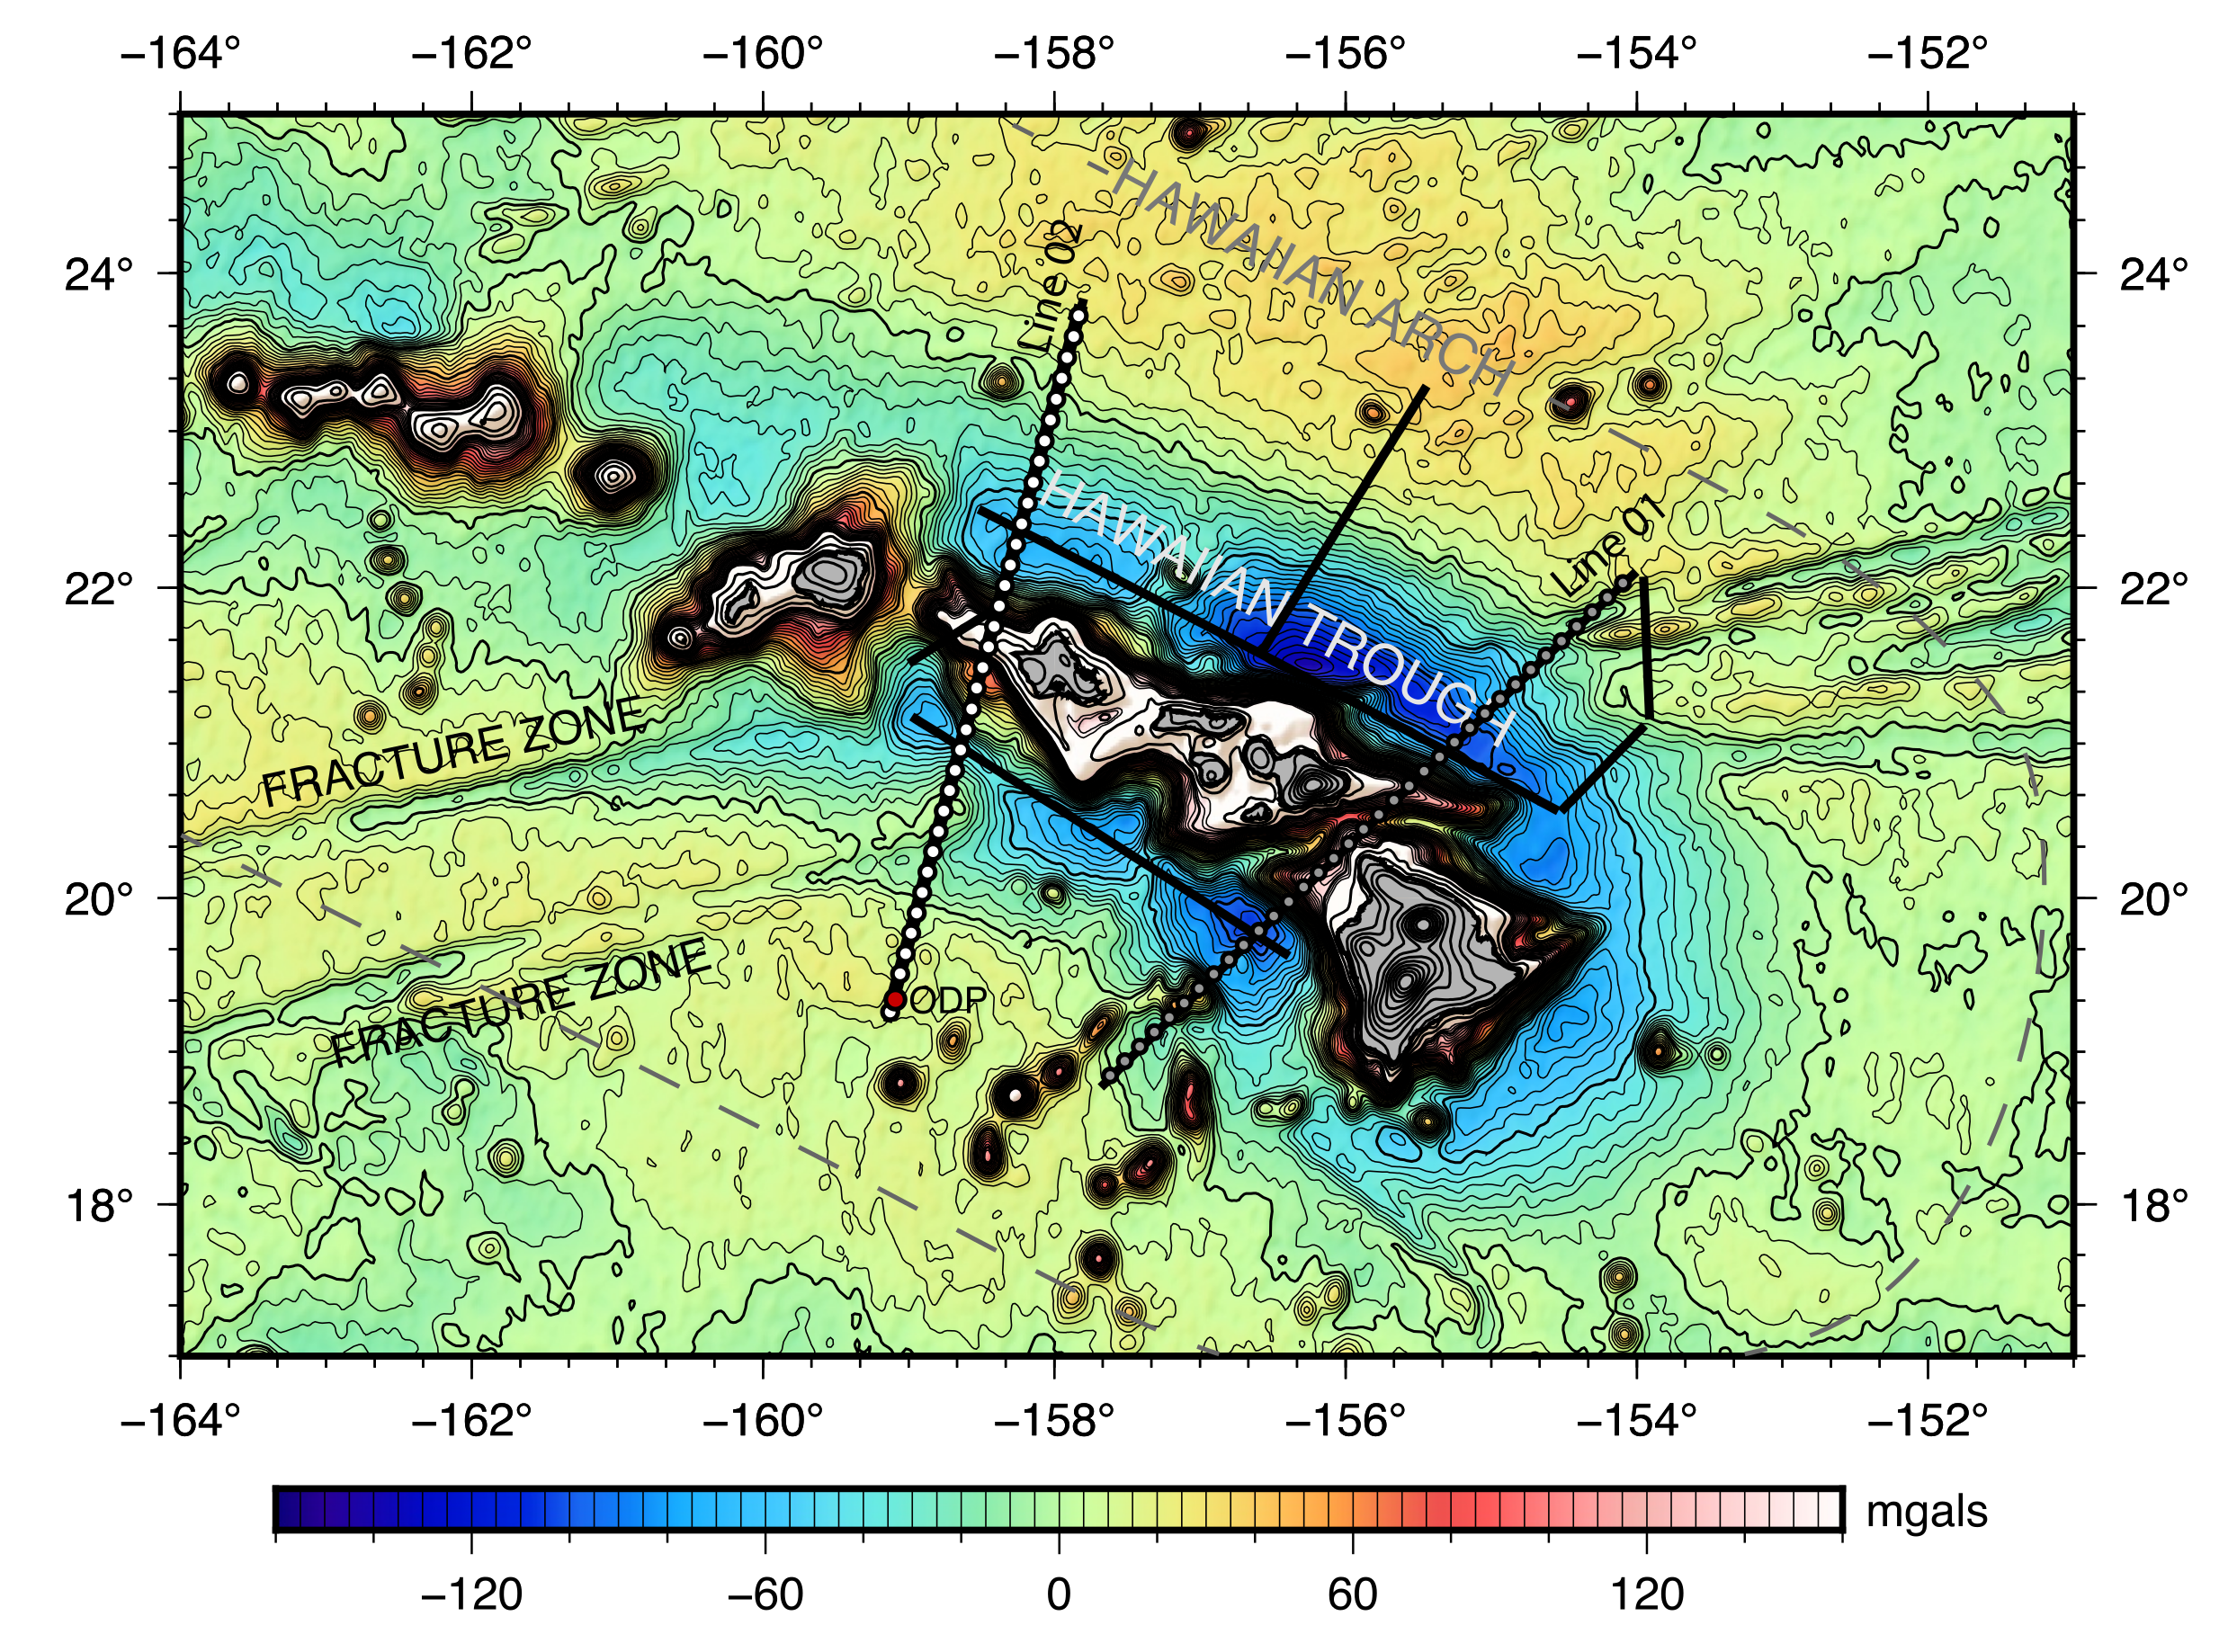
Free air gravity anomaly around Hawaii (~1000 km; Figure from Dunn et. al. 2024). Recall that free-air gravity anomalies are only corrected for the elevation difference from sea-level of the measurement. In practice, a specific geoid is used and it may not be perfect, but this anomaly highlights gravity differences due to more (positive anomaly) or less (negative anomaly) mass than expected beneath the observation.
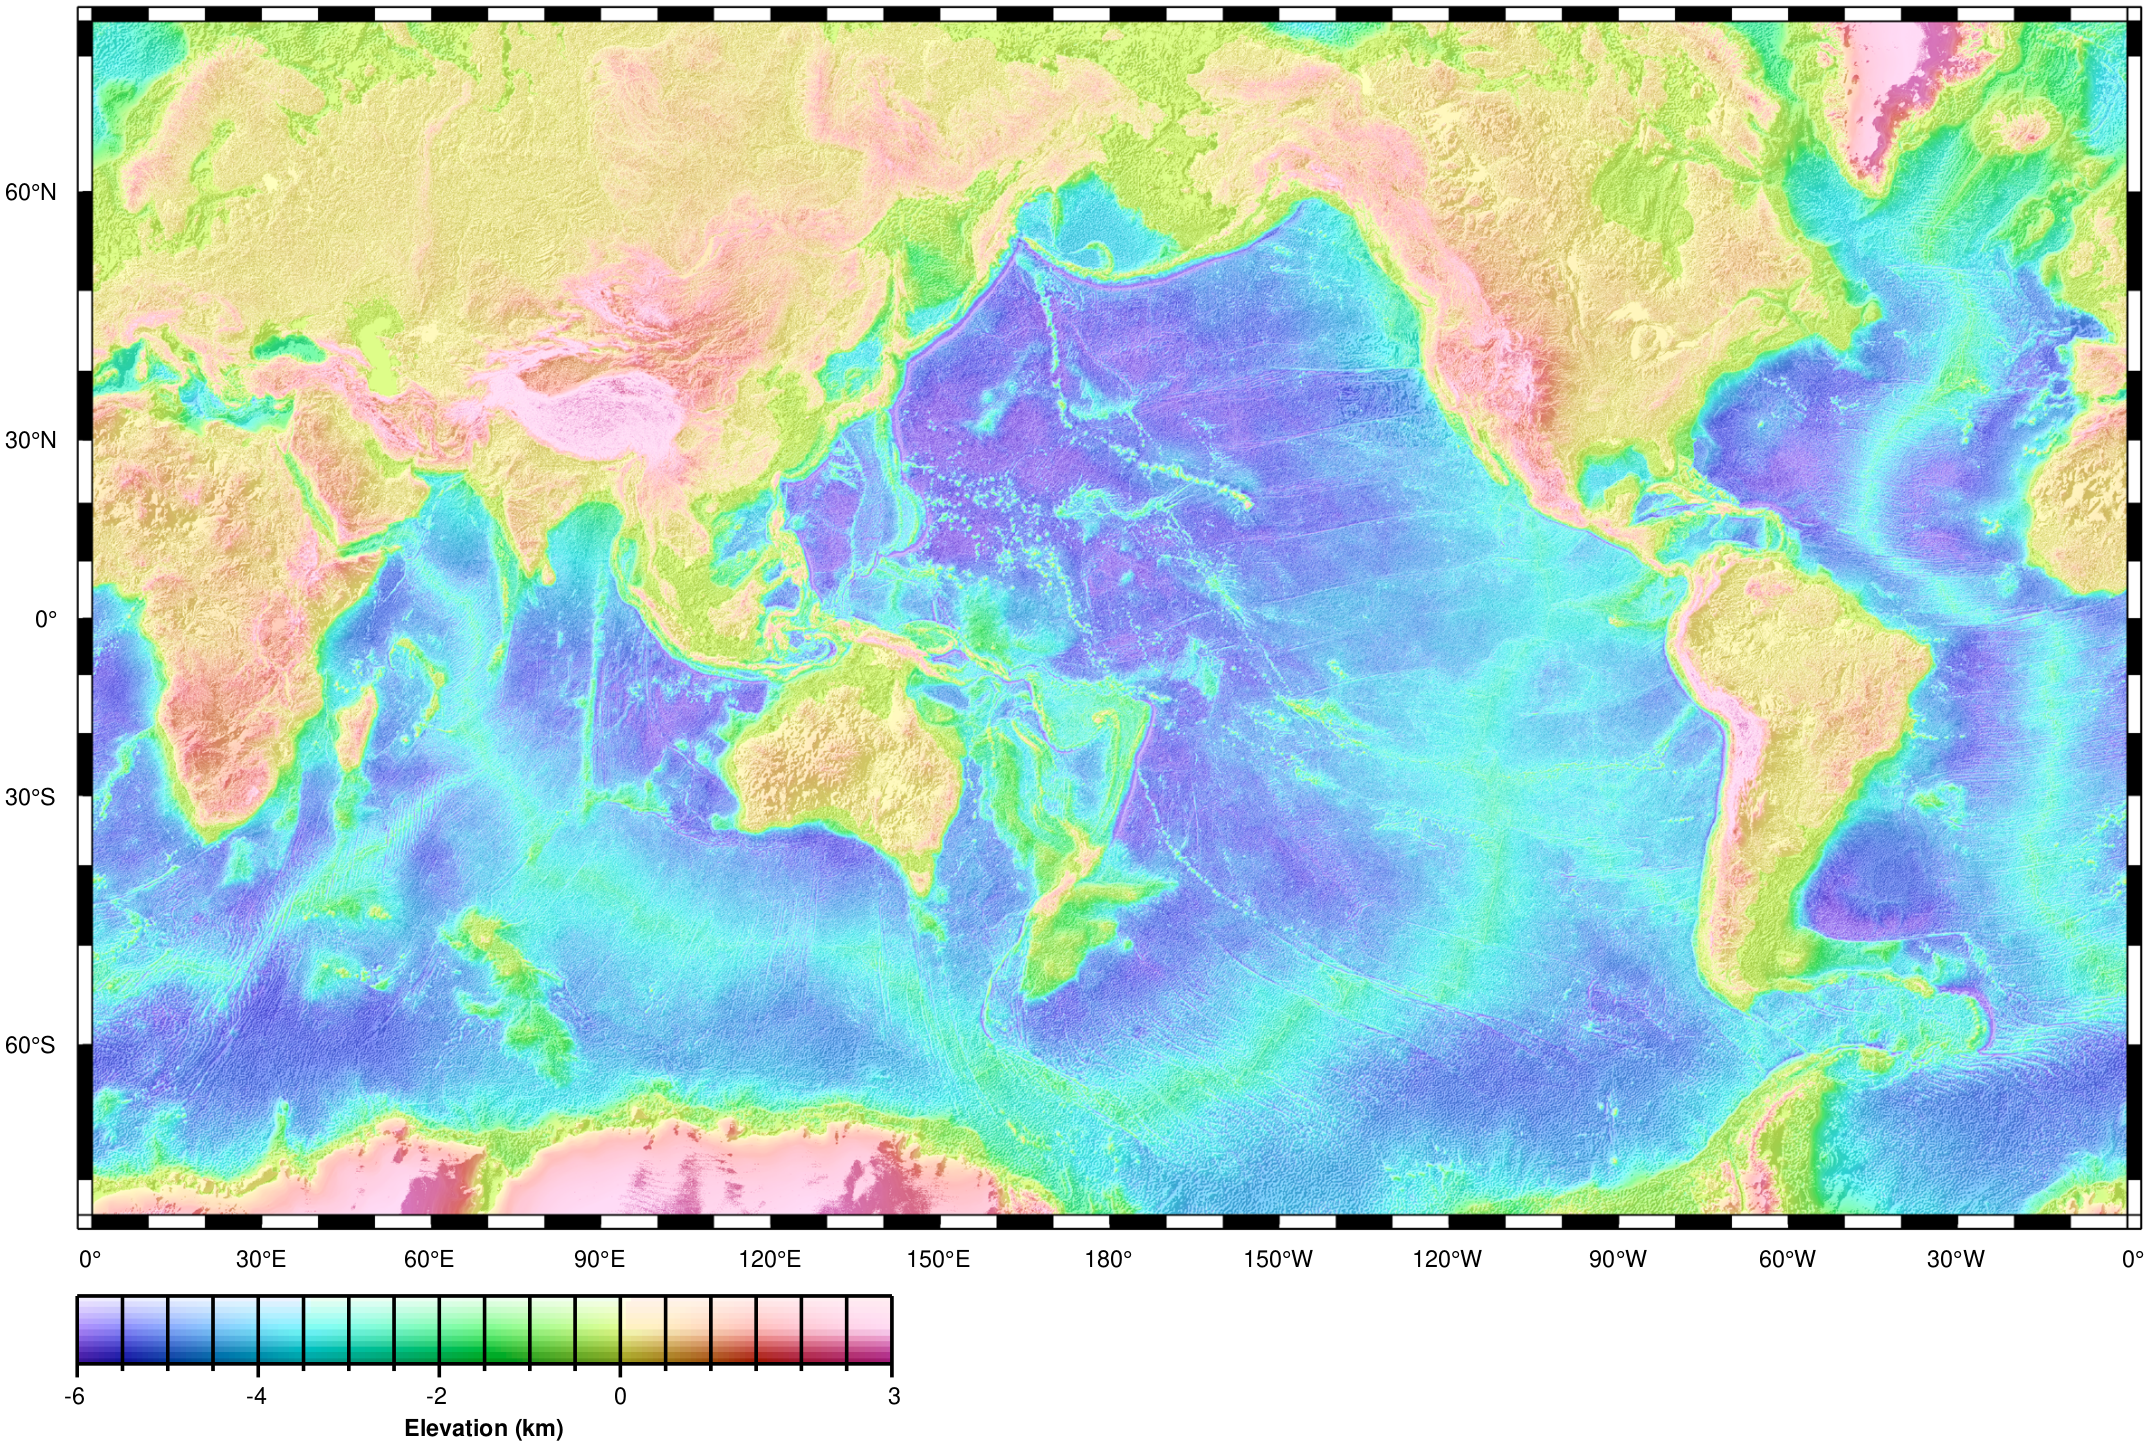
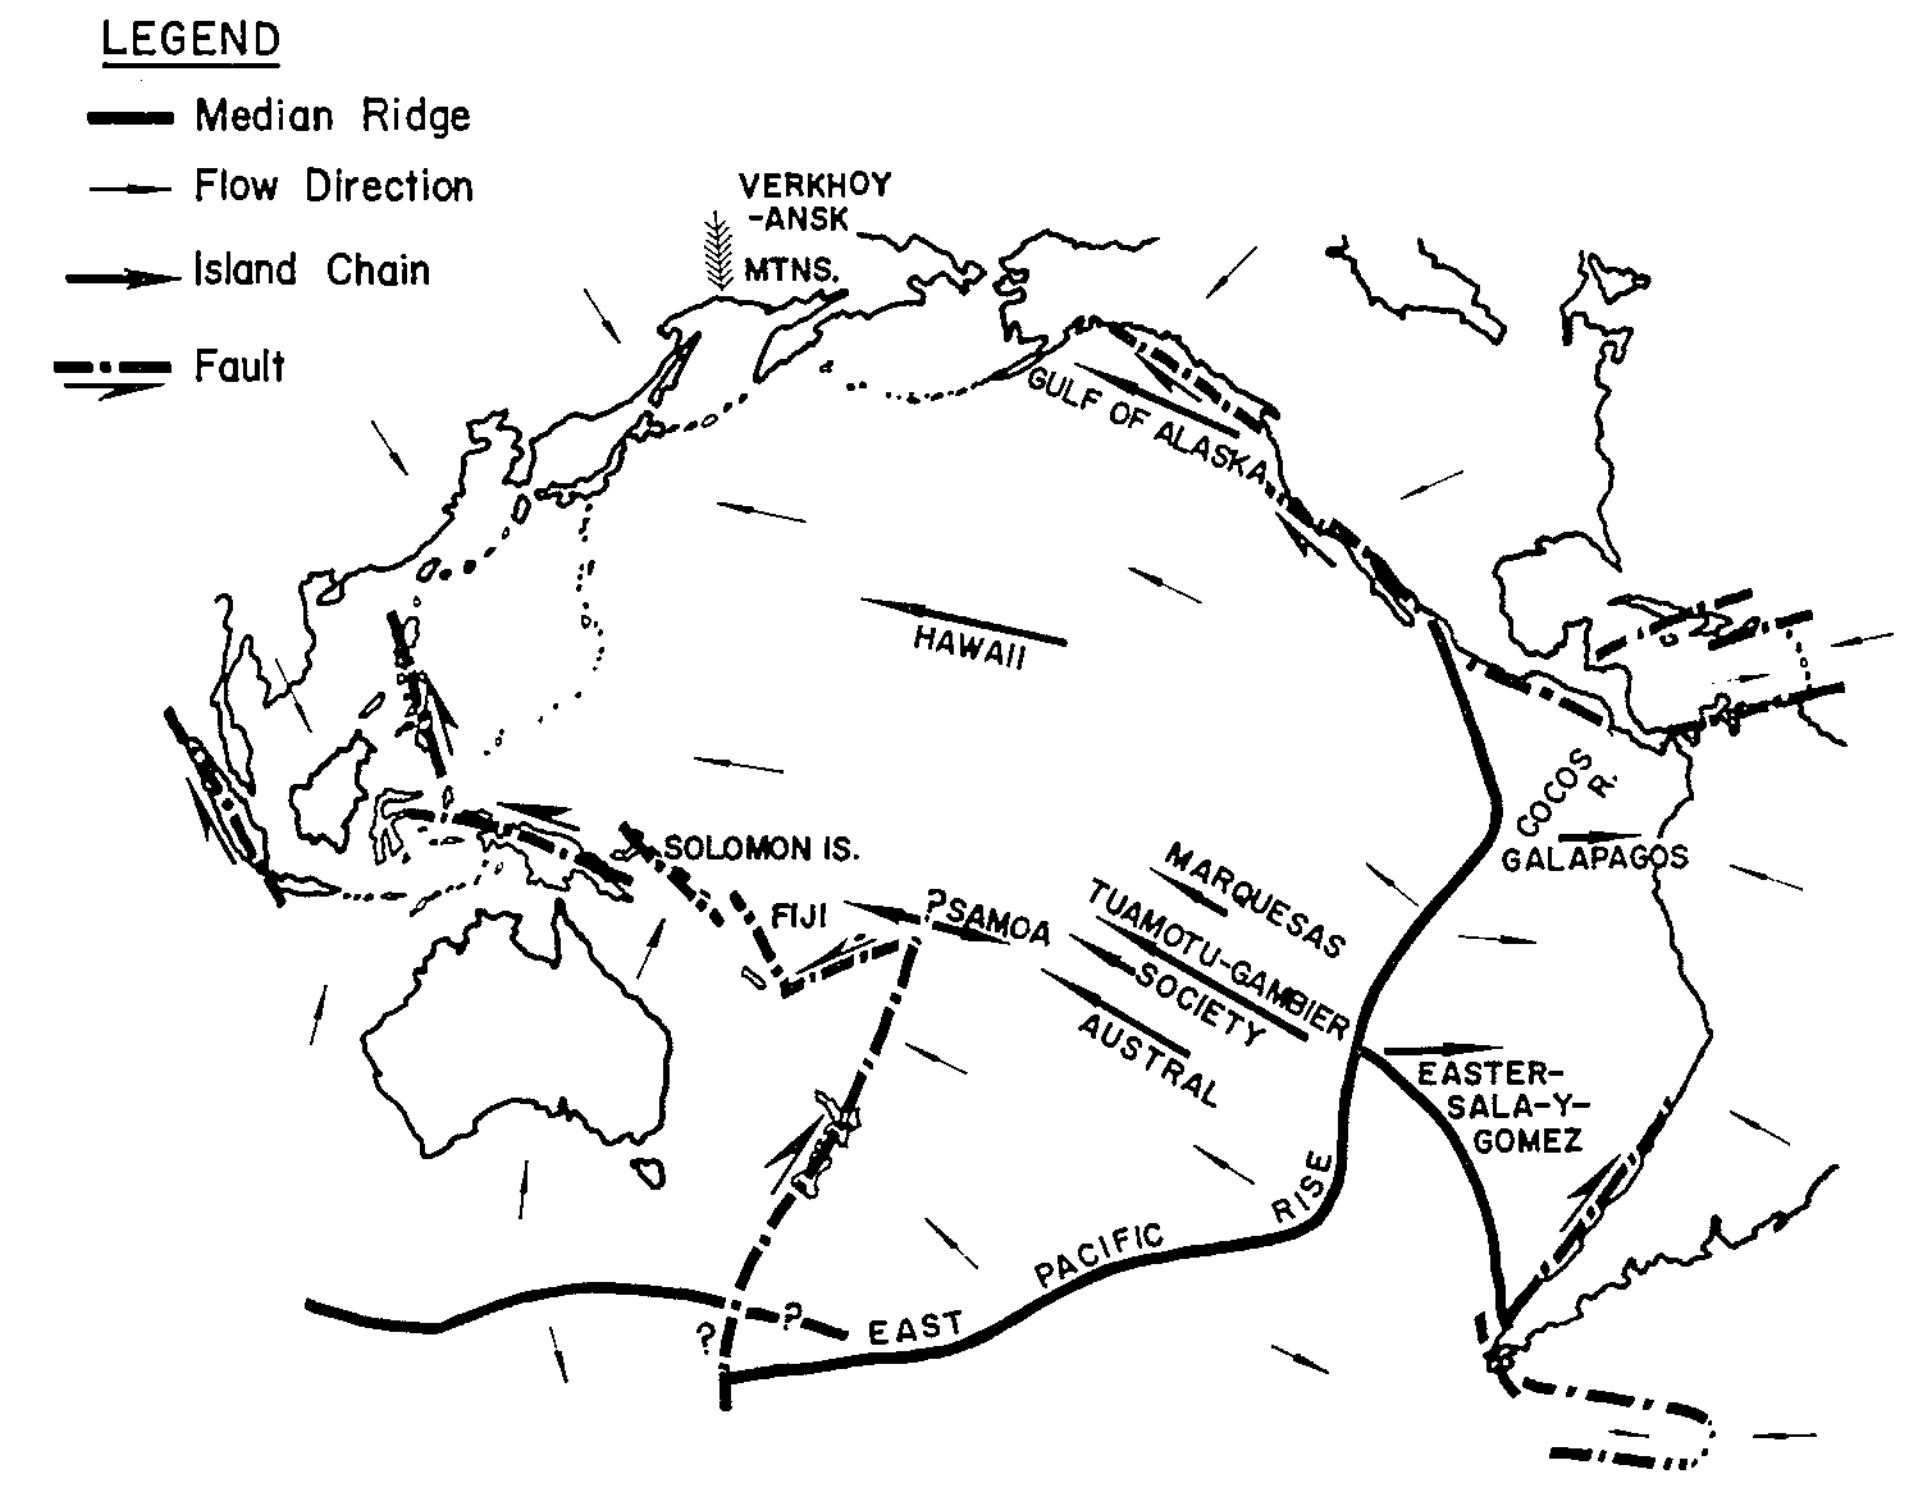
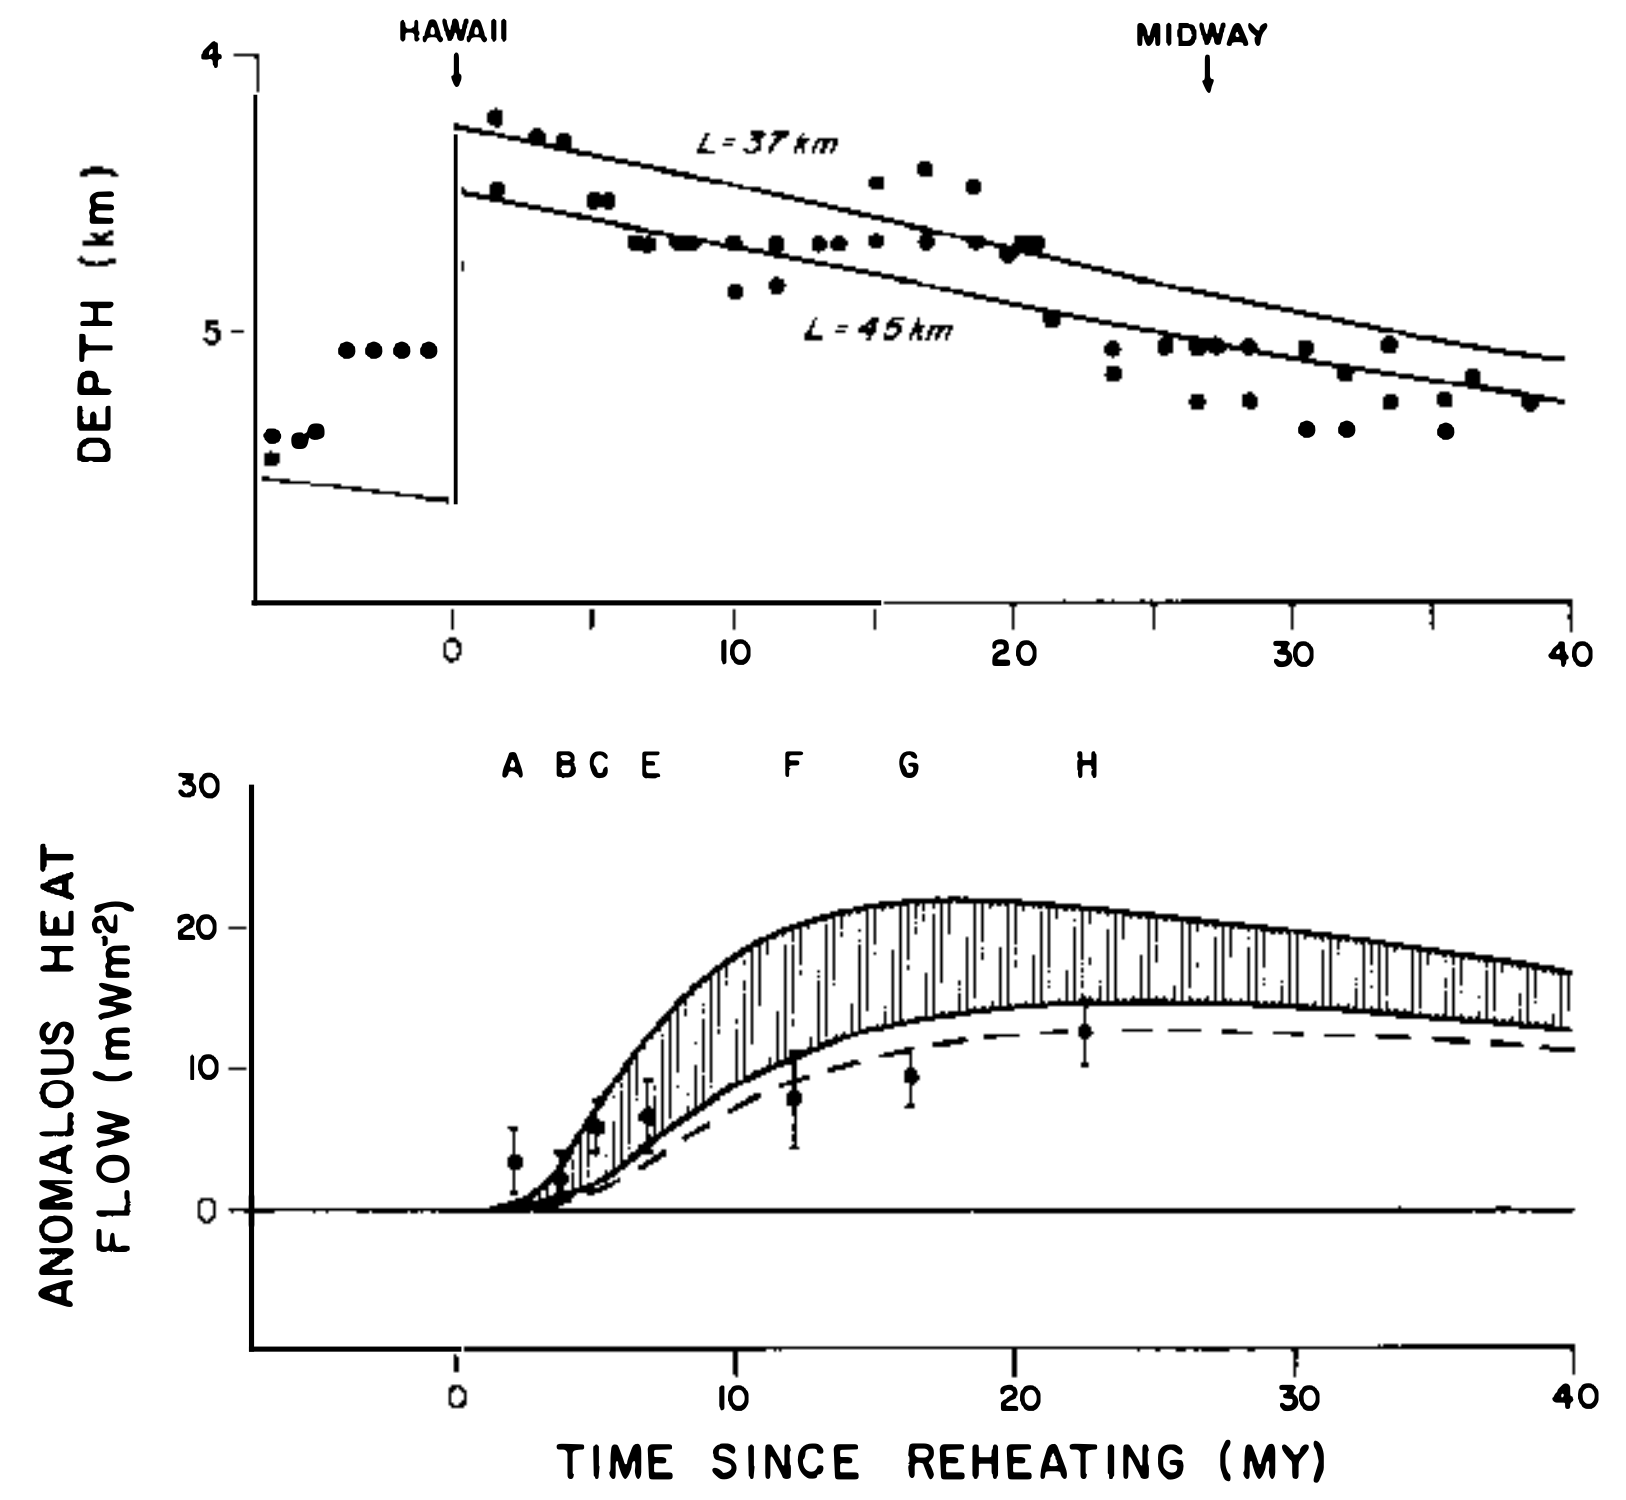
Swells and depth anomalies
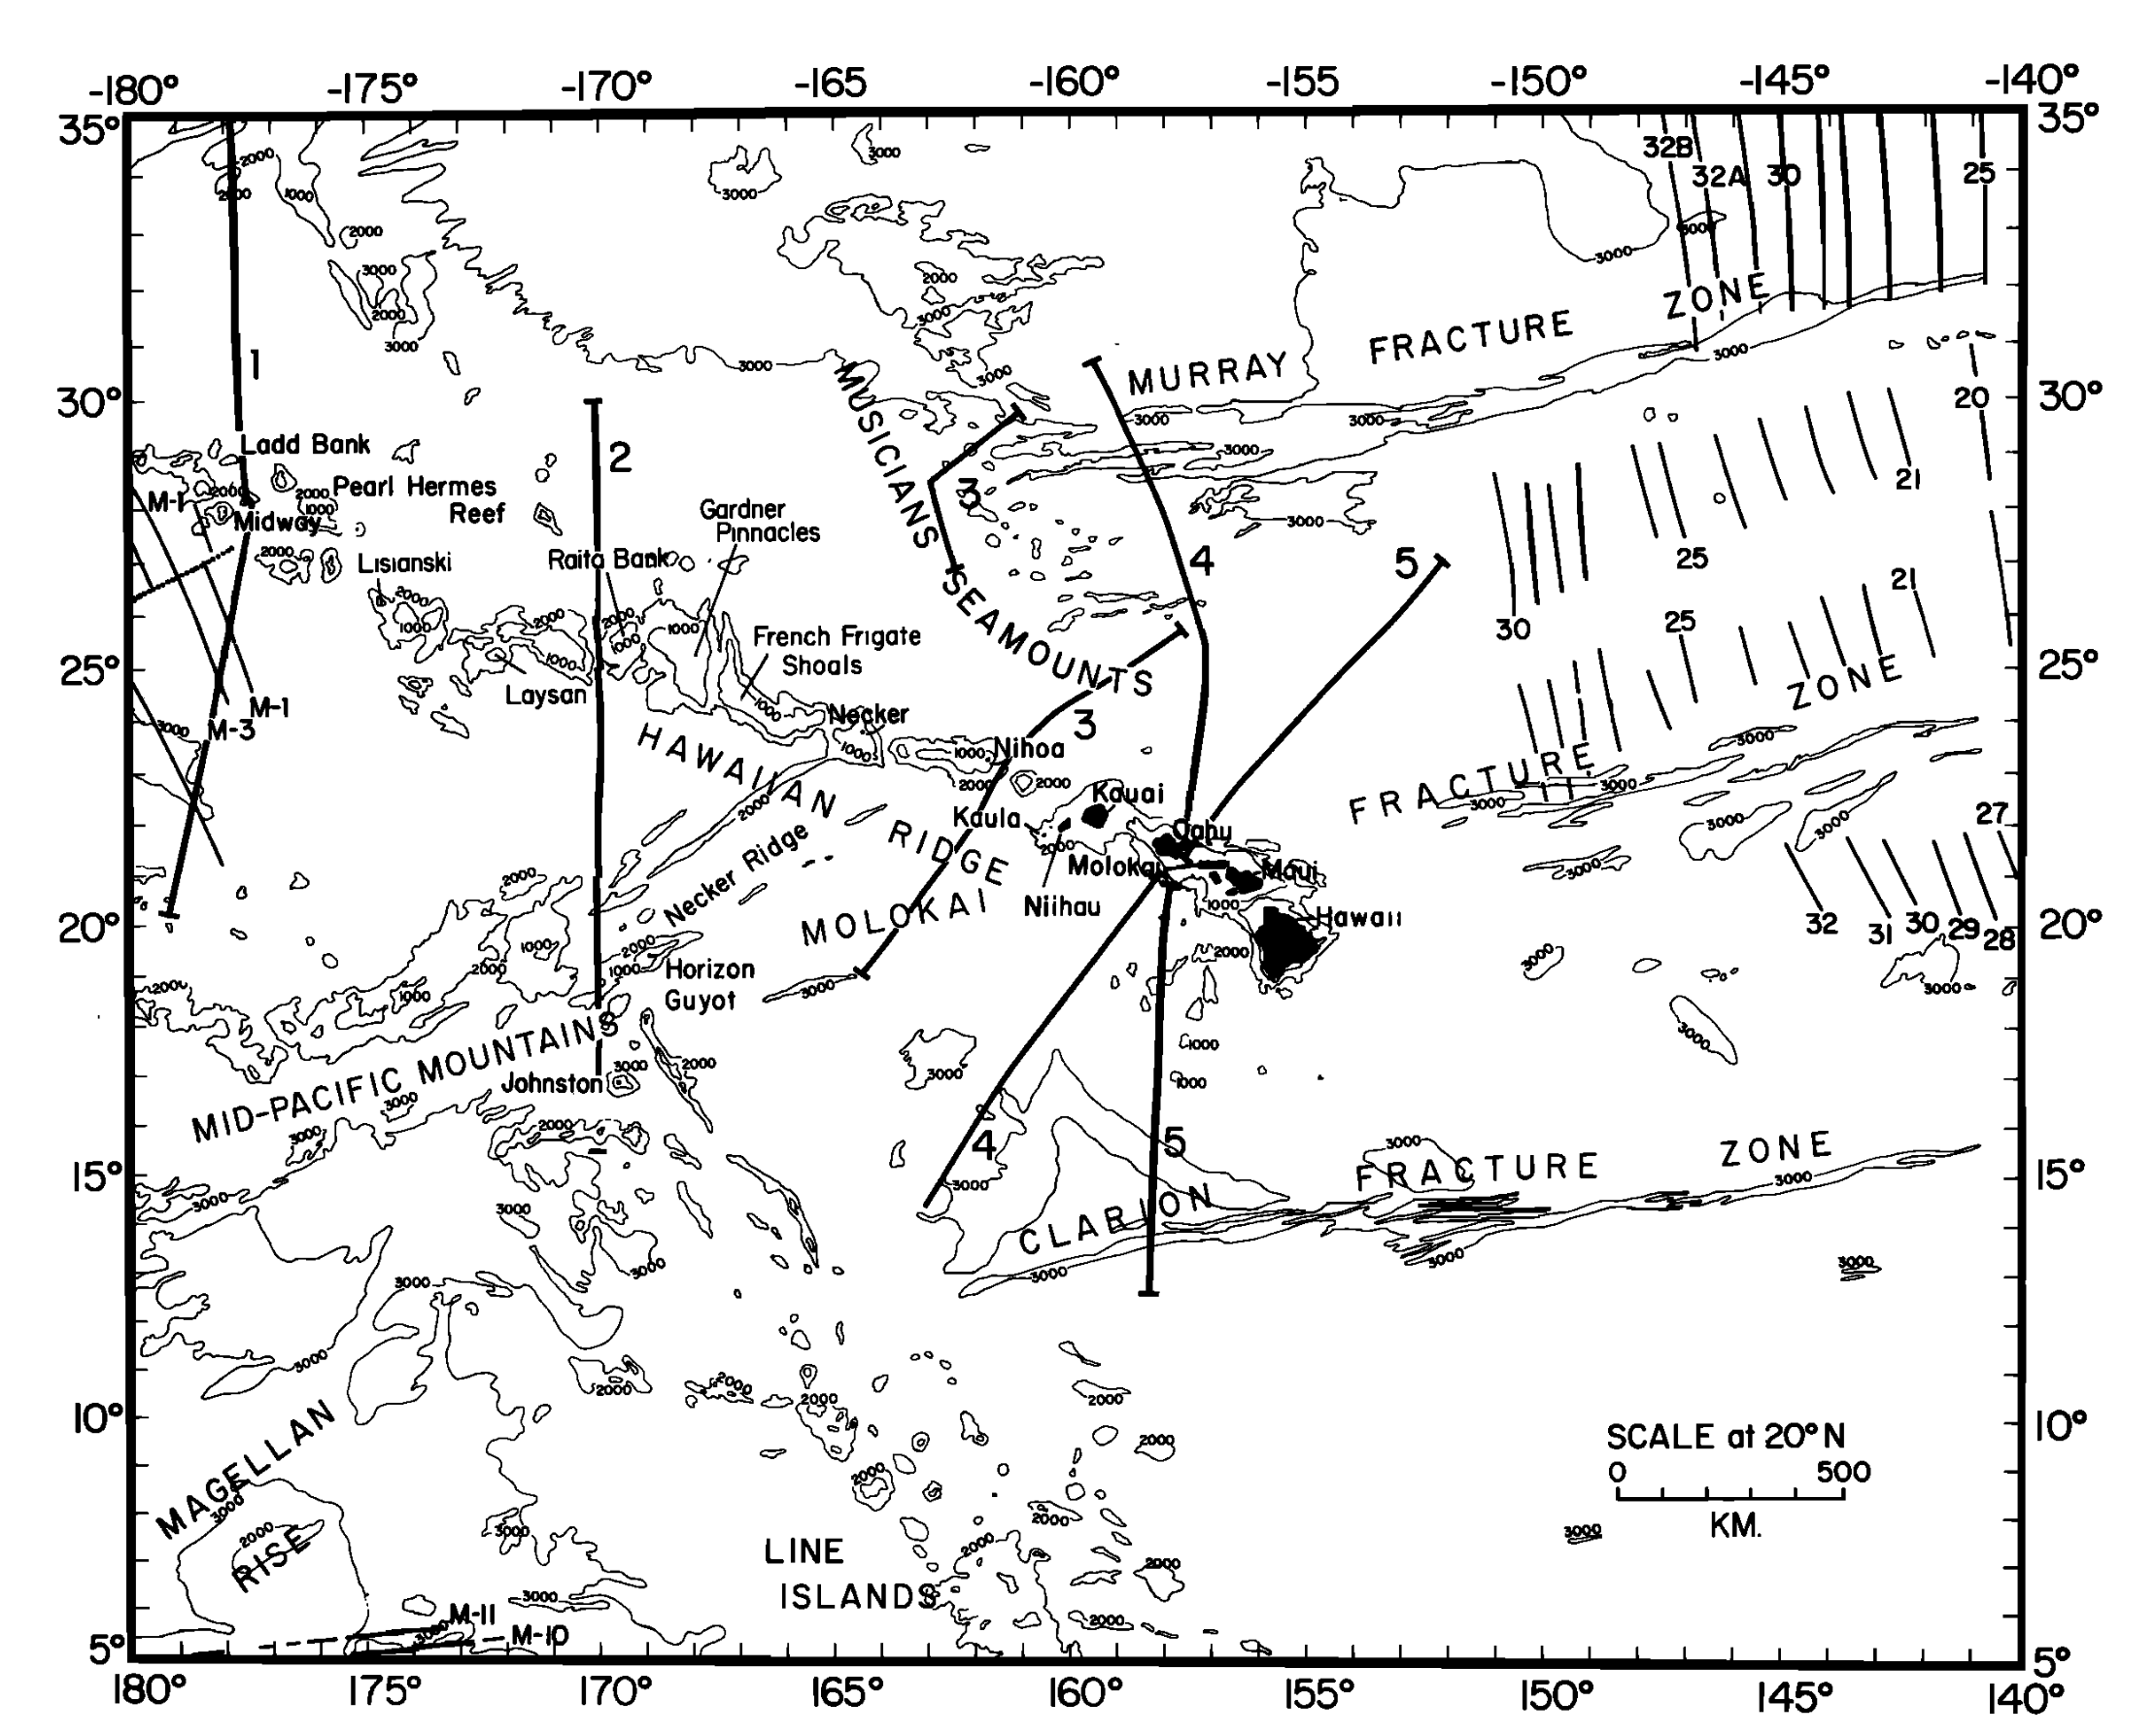
Bathymetry of the Pacific. Transect #5 is the next figure. (Watts 1976).
Swells and depth anomalies
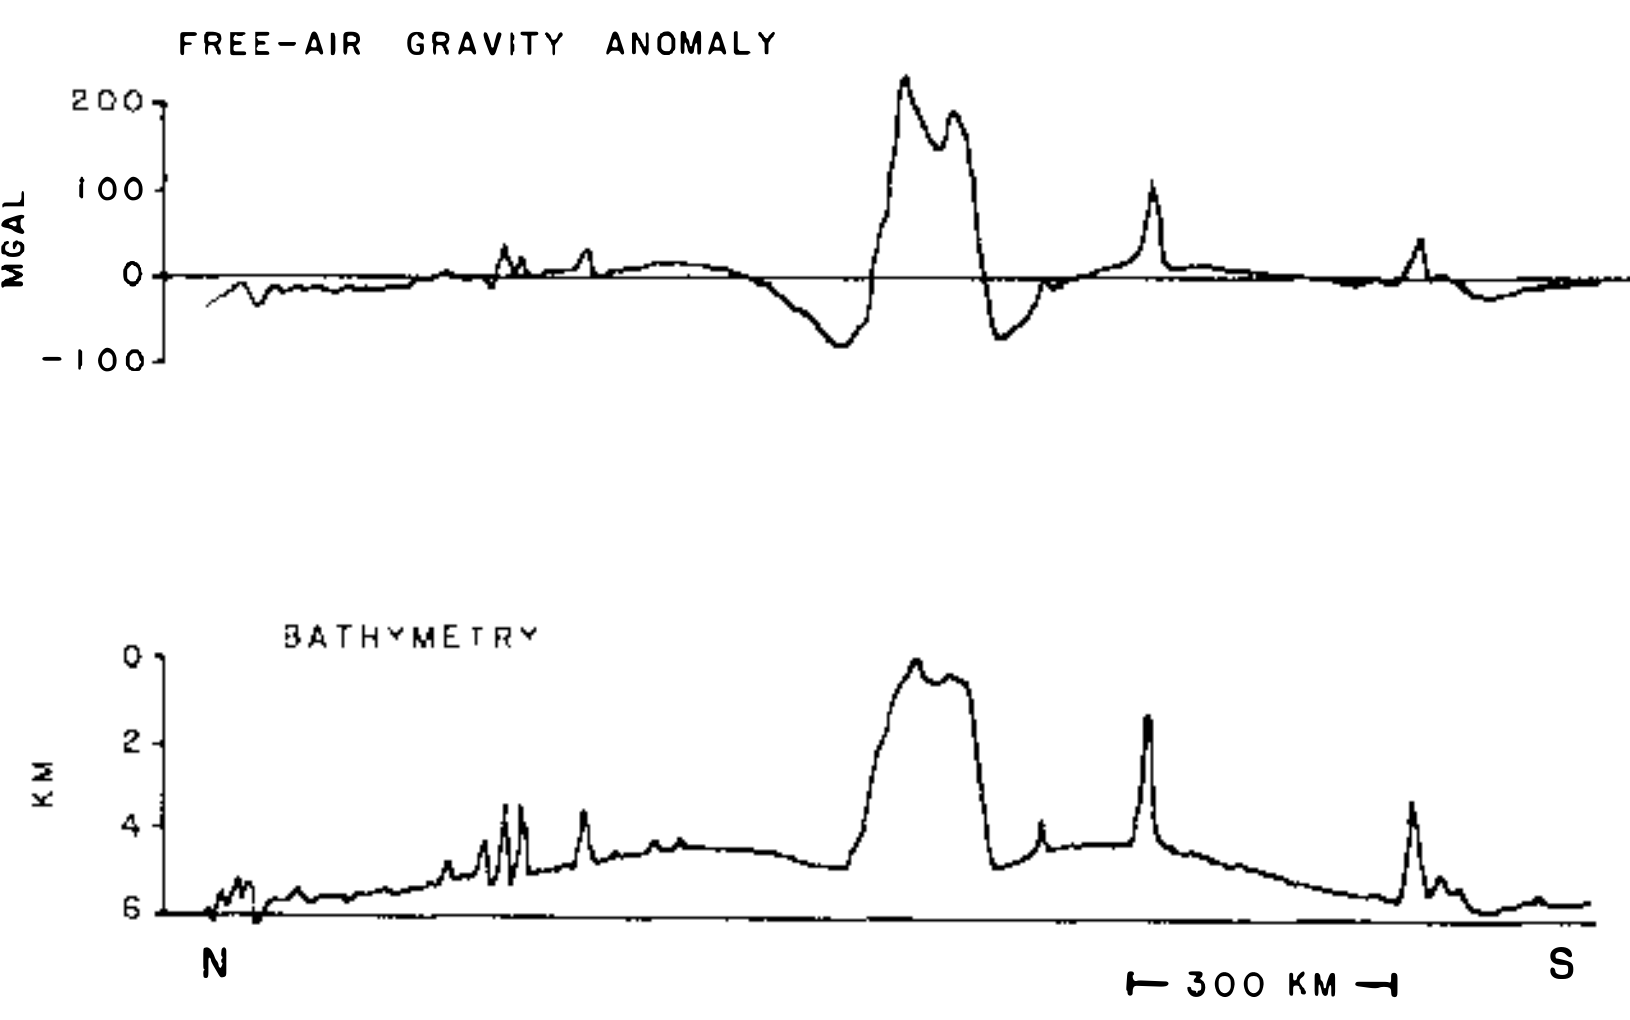
Transects across Hawaii (Crough 1983)
How are swells supported?
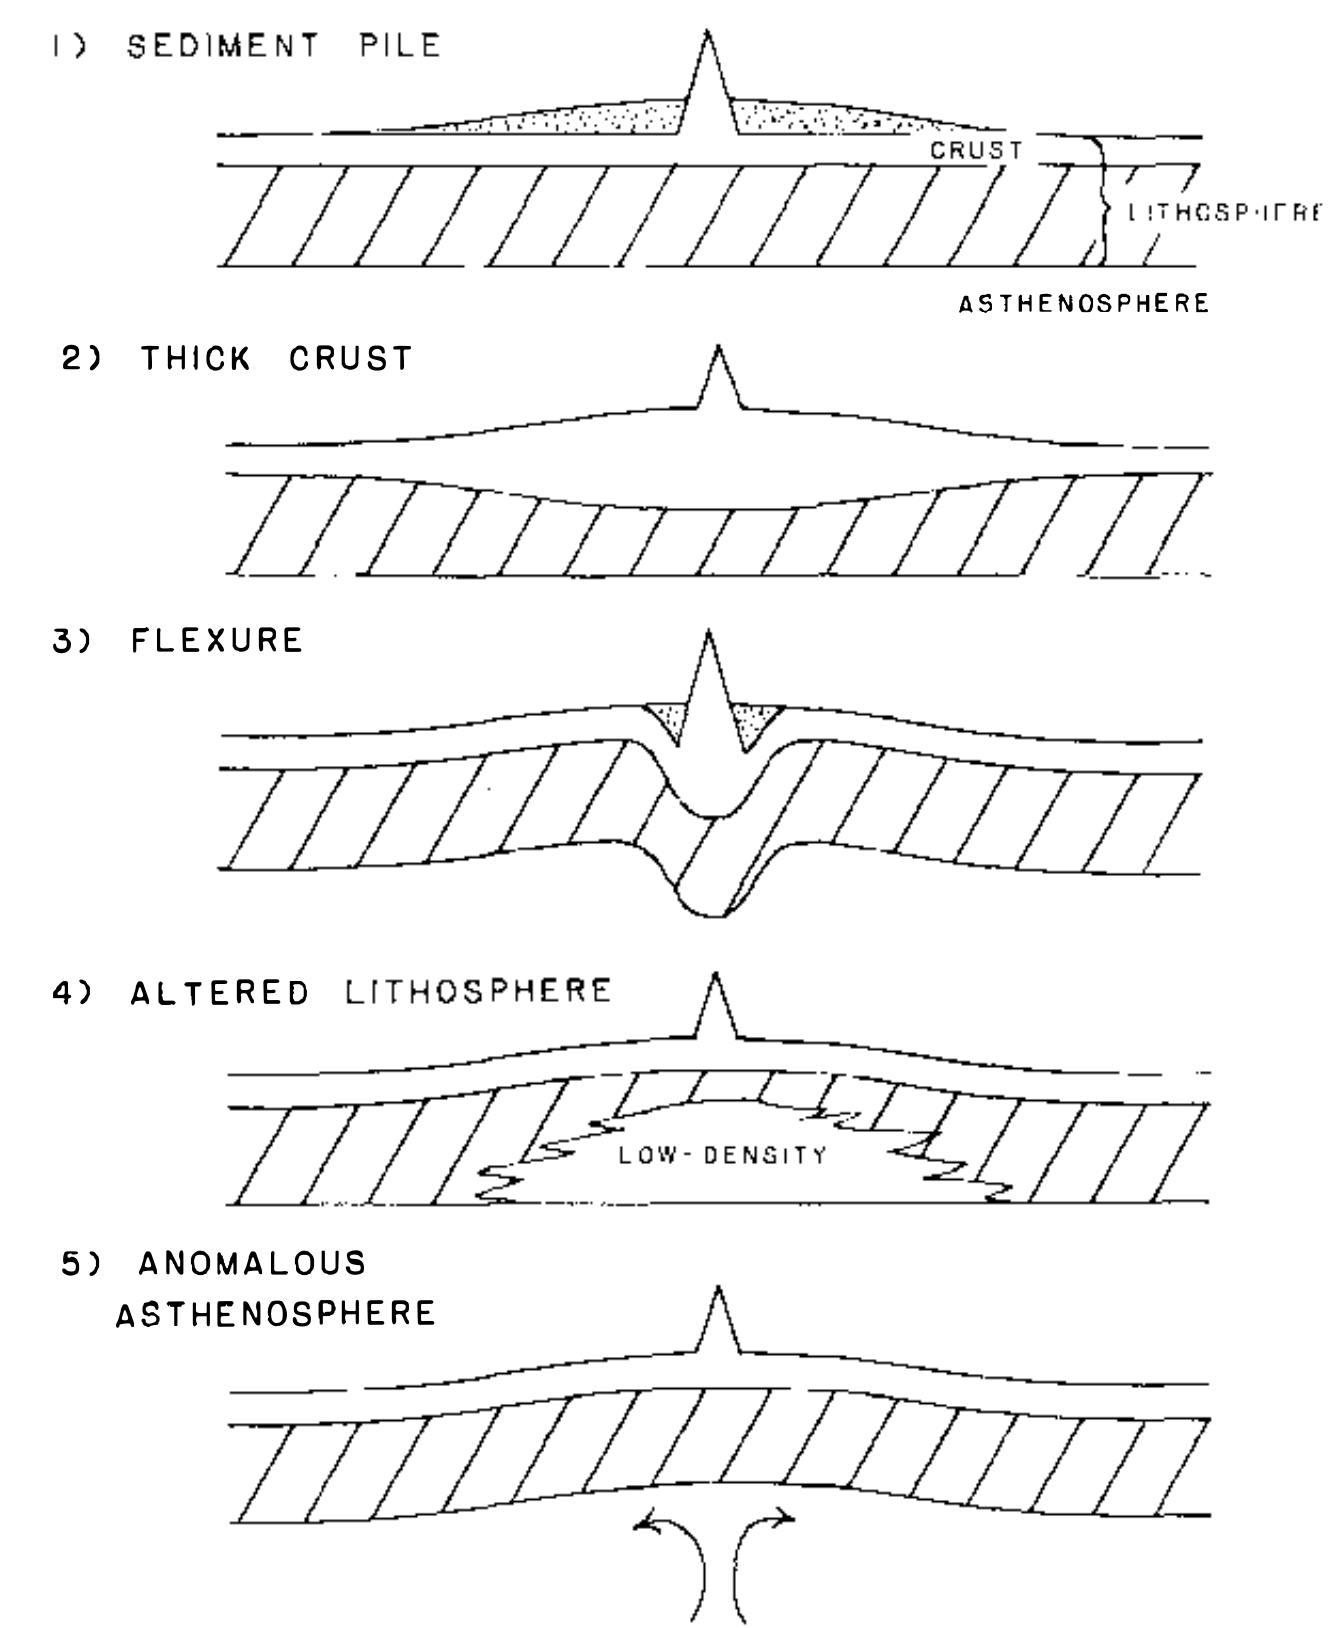
How are swells supported?
Constant crustal thickness
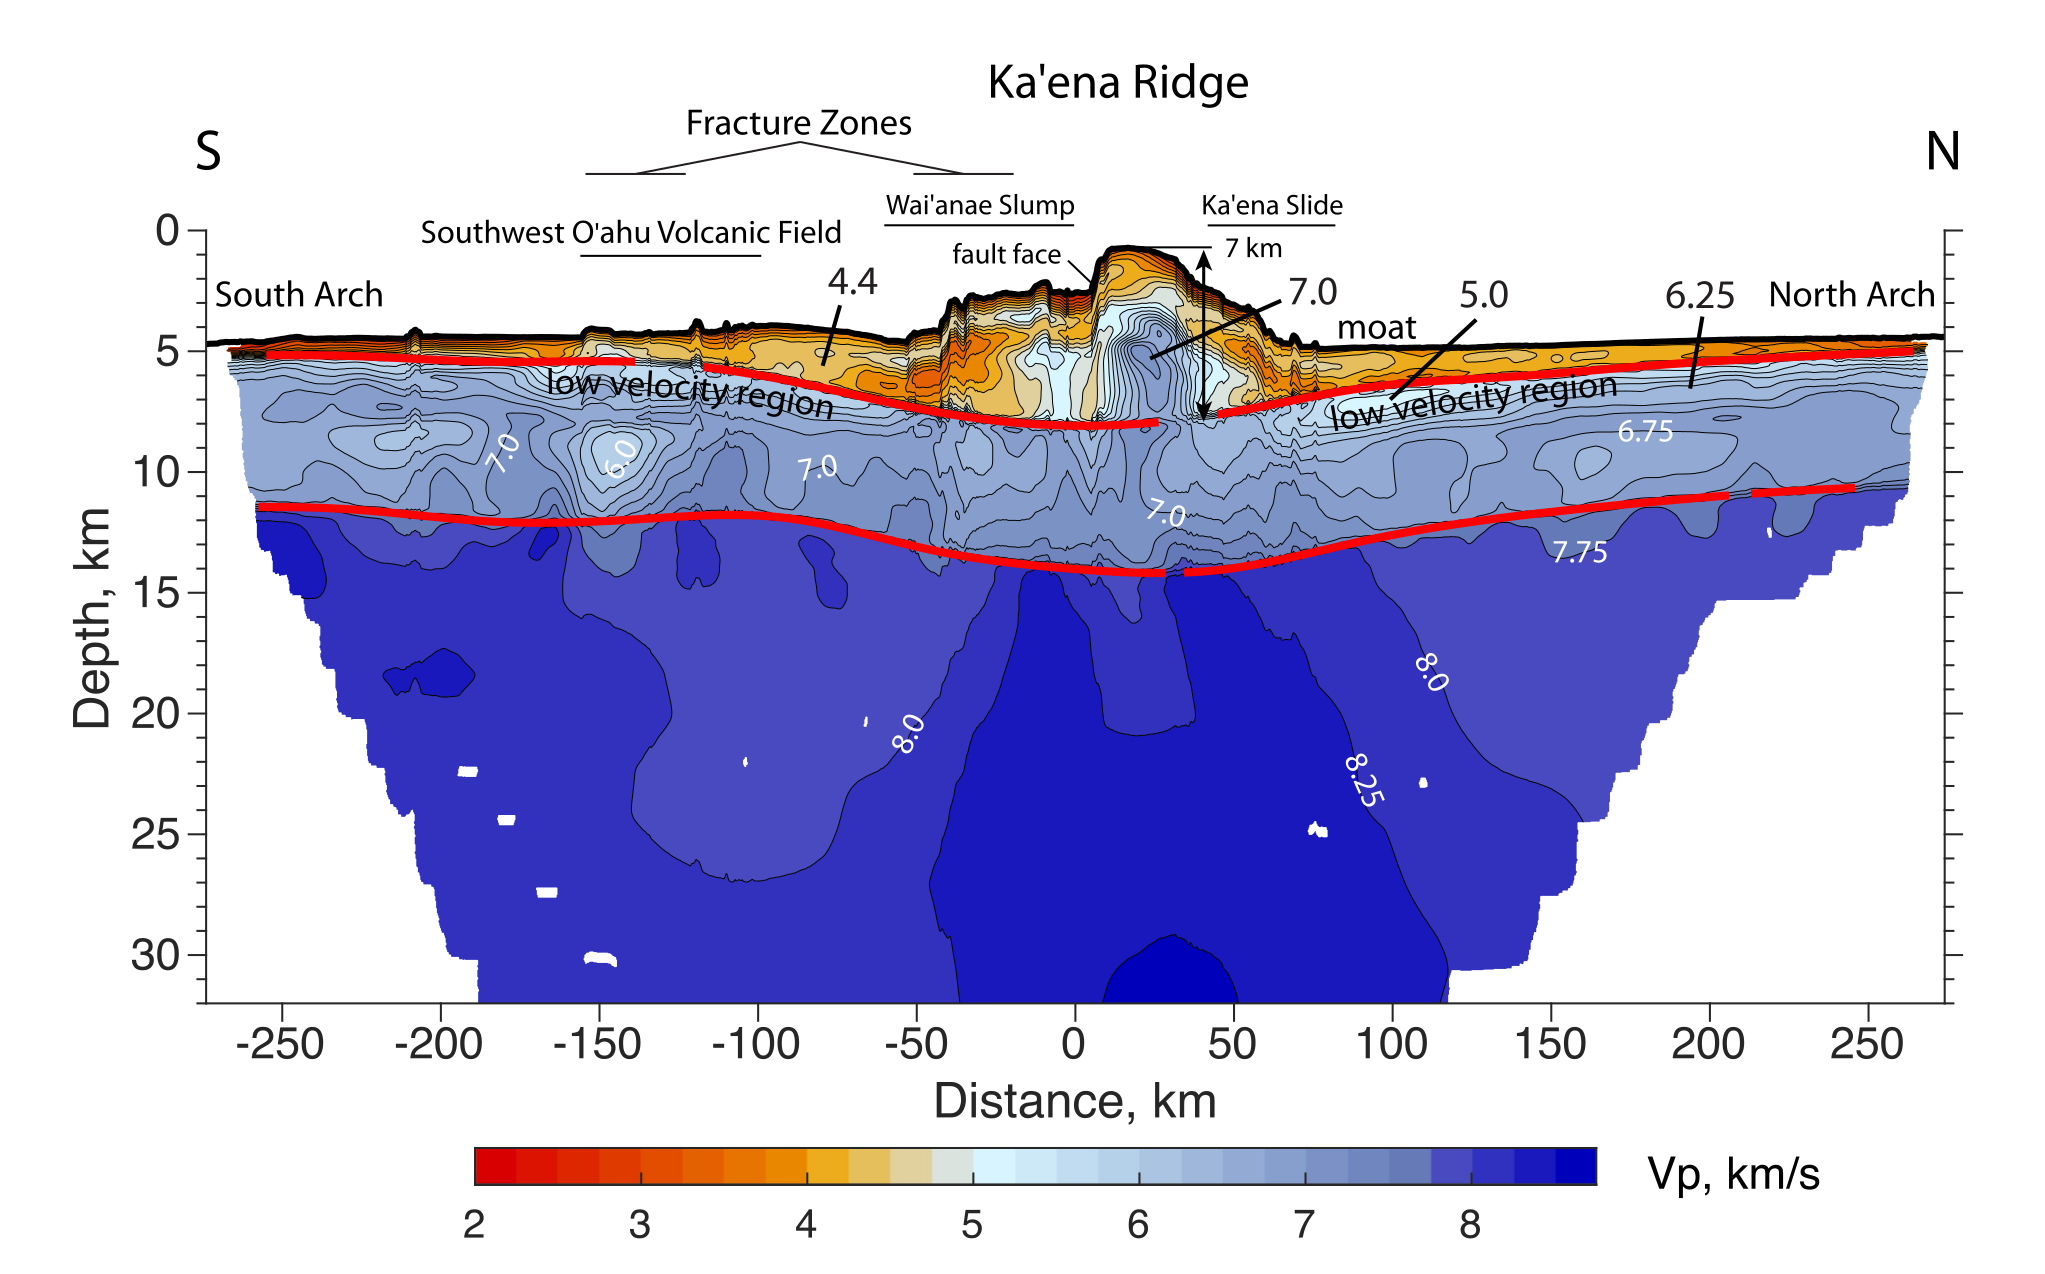
Dunn et. al. 2024
Constant crustal thickness
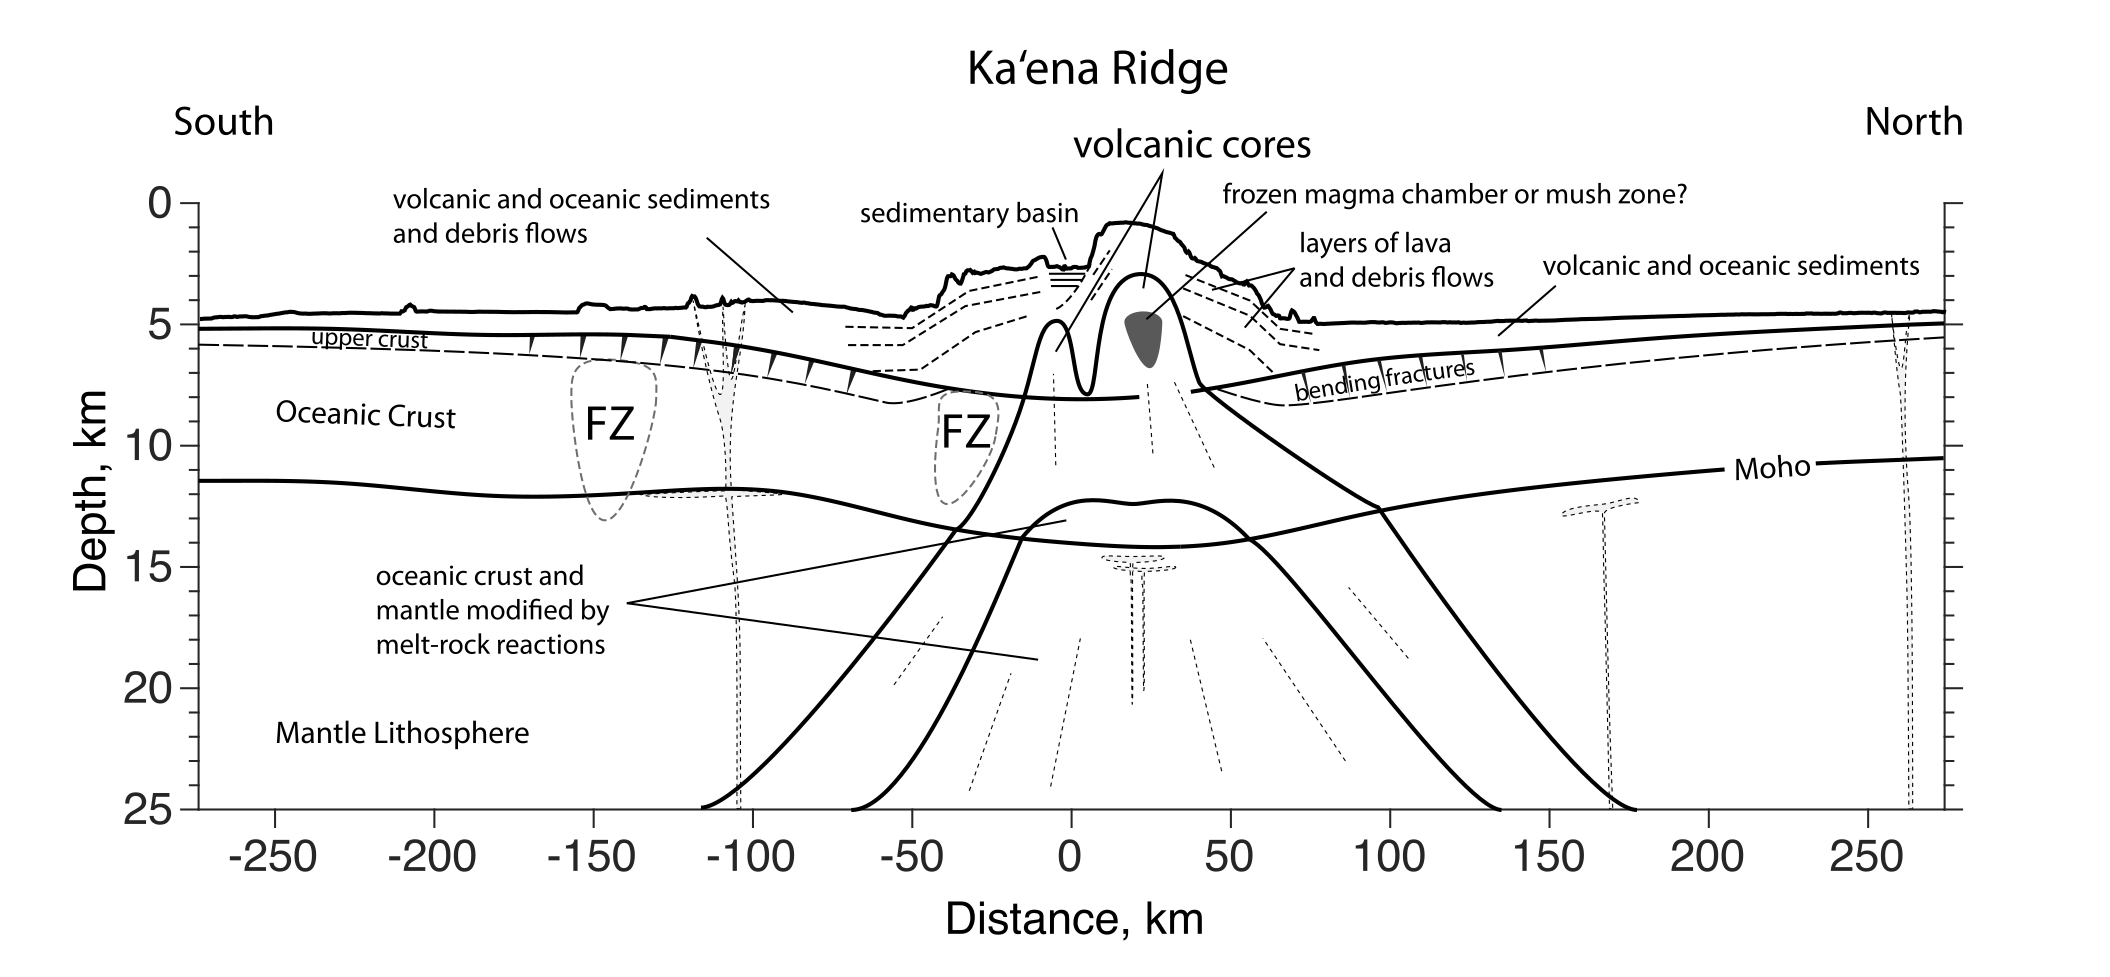
Dunn et. al. 2024