Lecture 6: Hot spots, seamounts, and ridges
The topography and geology of the seafloor offers some of the only clues we have to understanding the hidden workings of the mantle below. We have discussed some of the largest features of ocean basins, and today we consider the small seamounts and their critical role in this story.
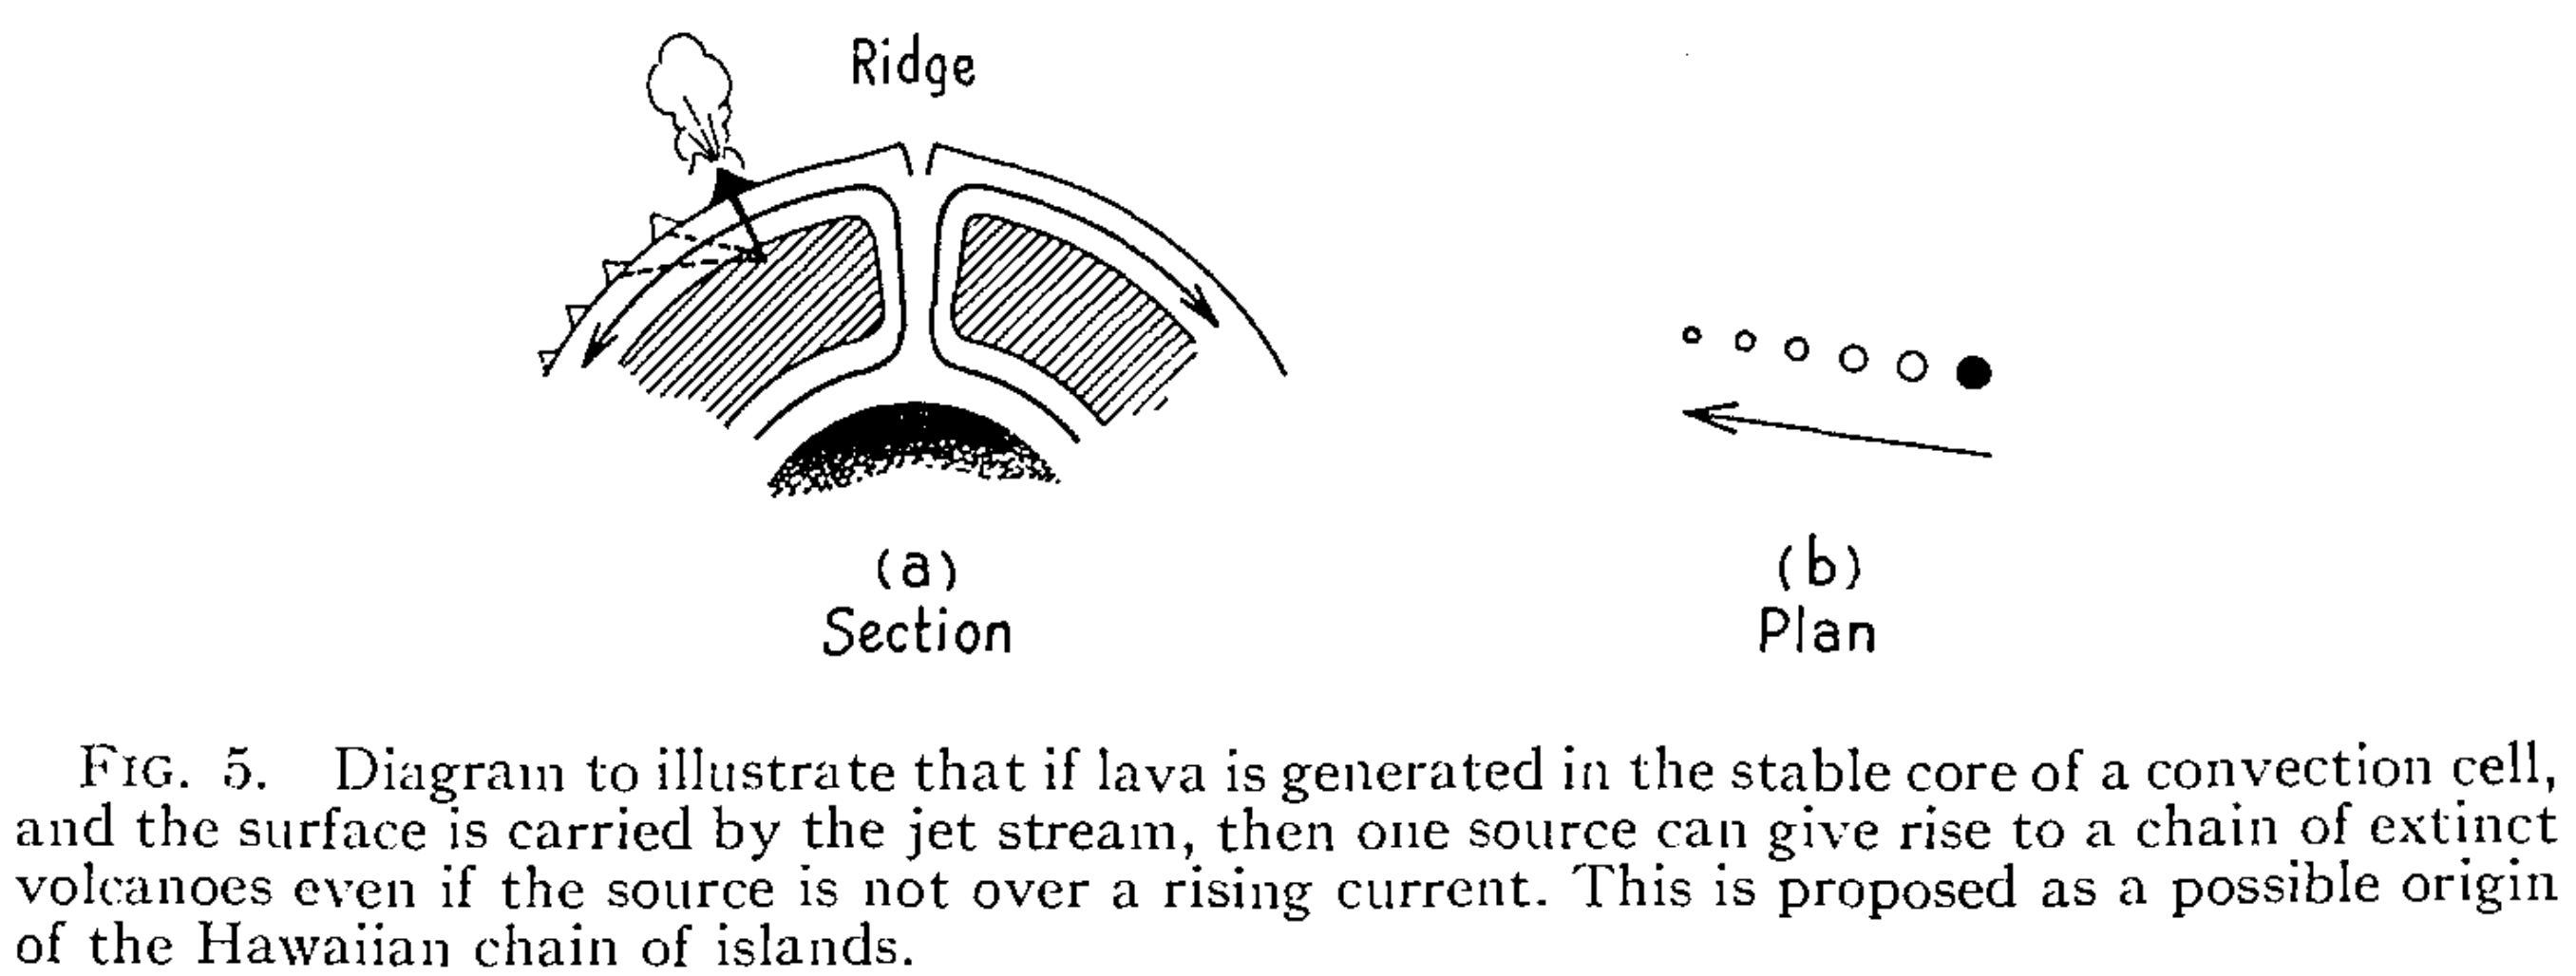
- Plumes, stationary or not?
- Axial depth vs melt chemistry
- Trace elements and isotopes in MORB vs OIB
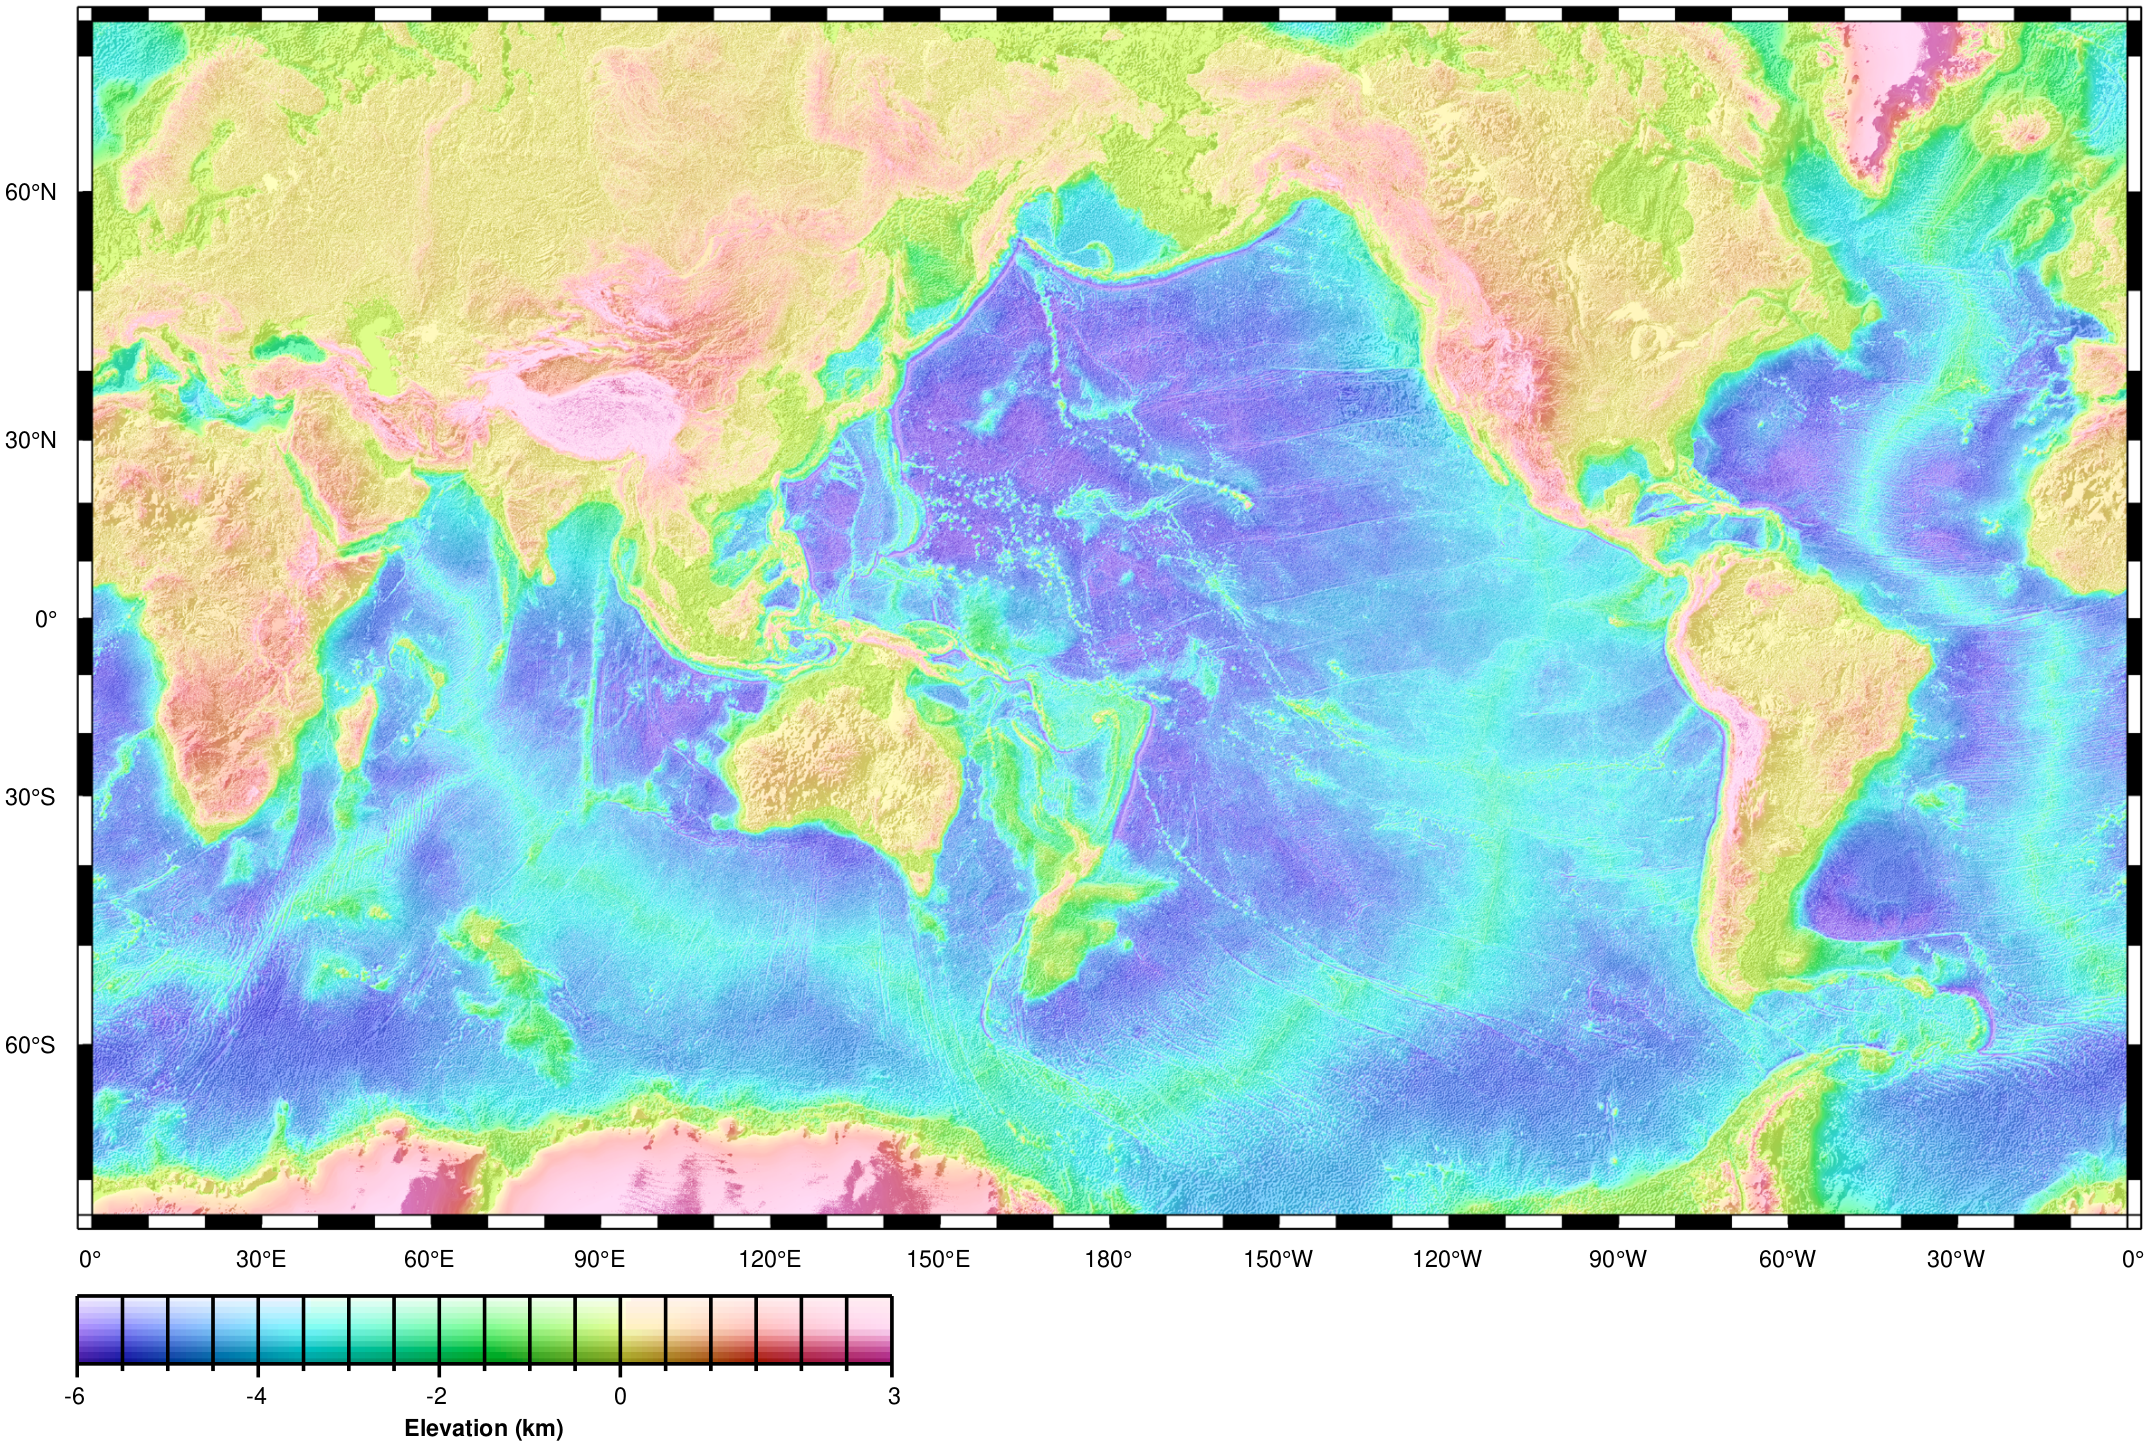
Features of the seafloor
The source of lavas must be deep
Swells and depth anomalies
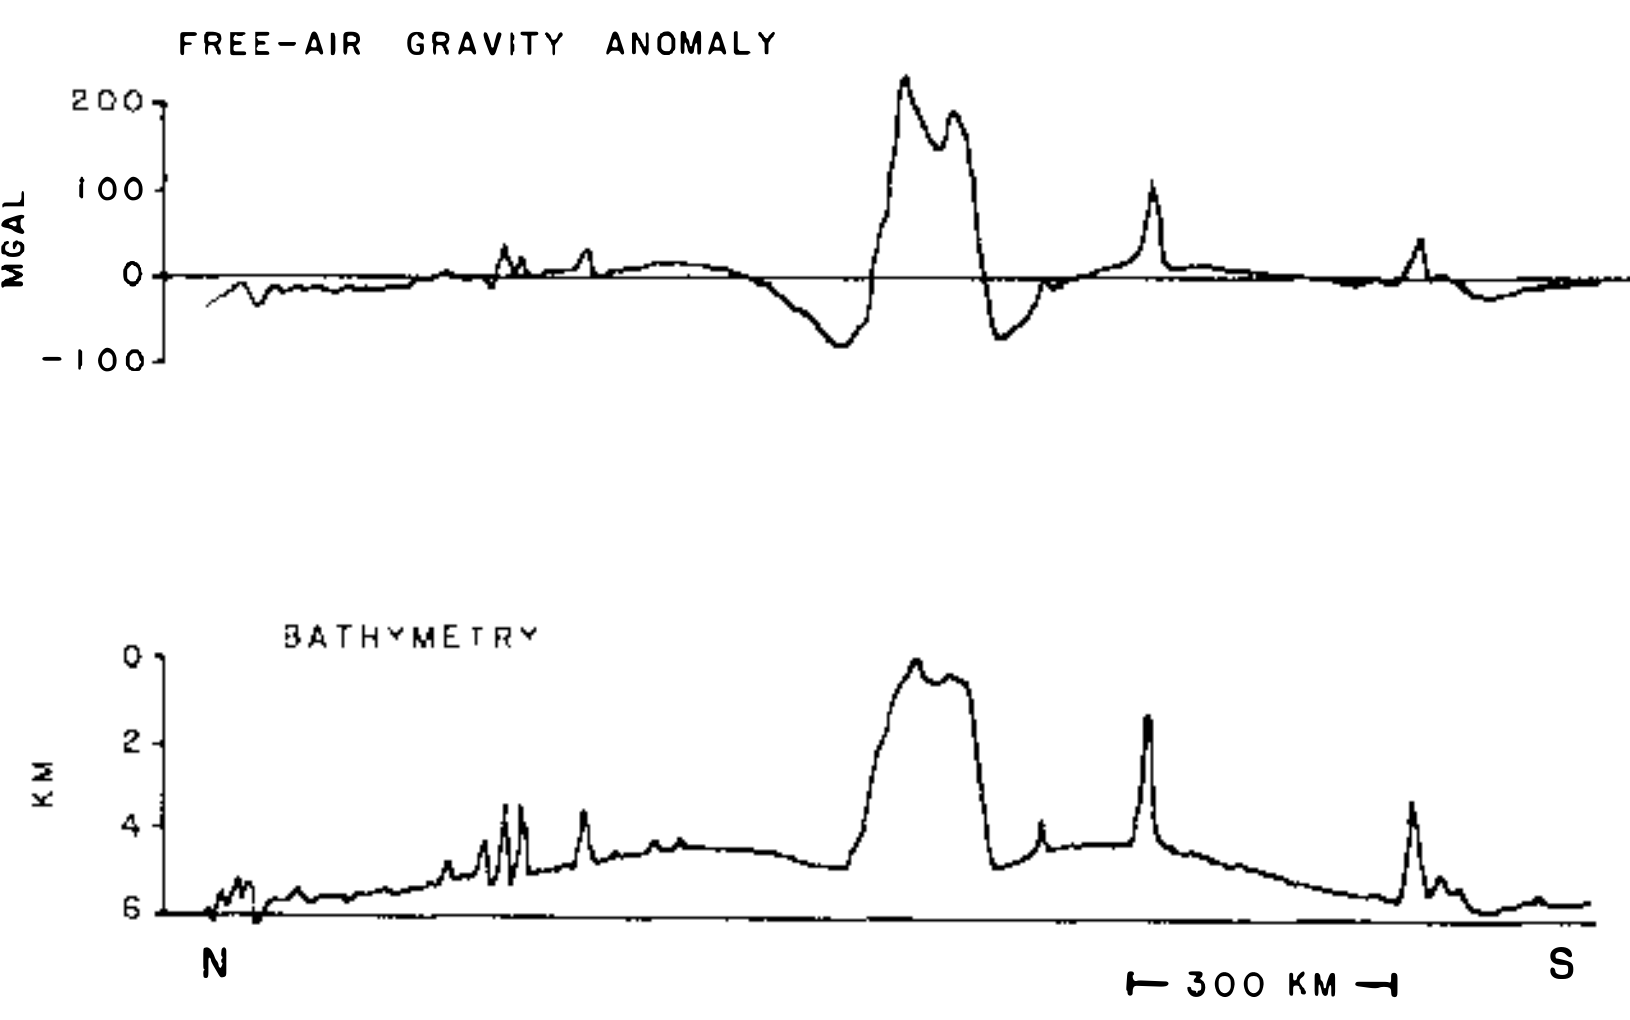
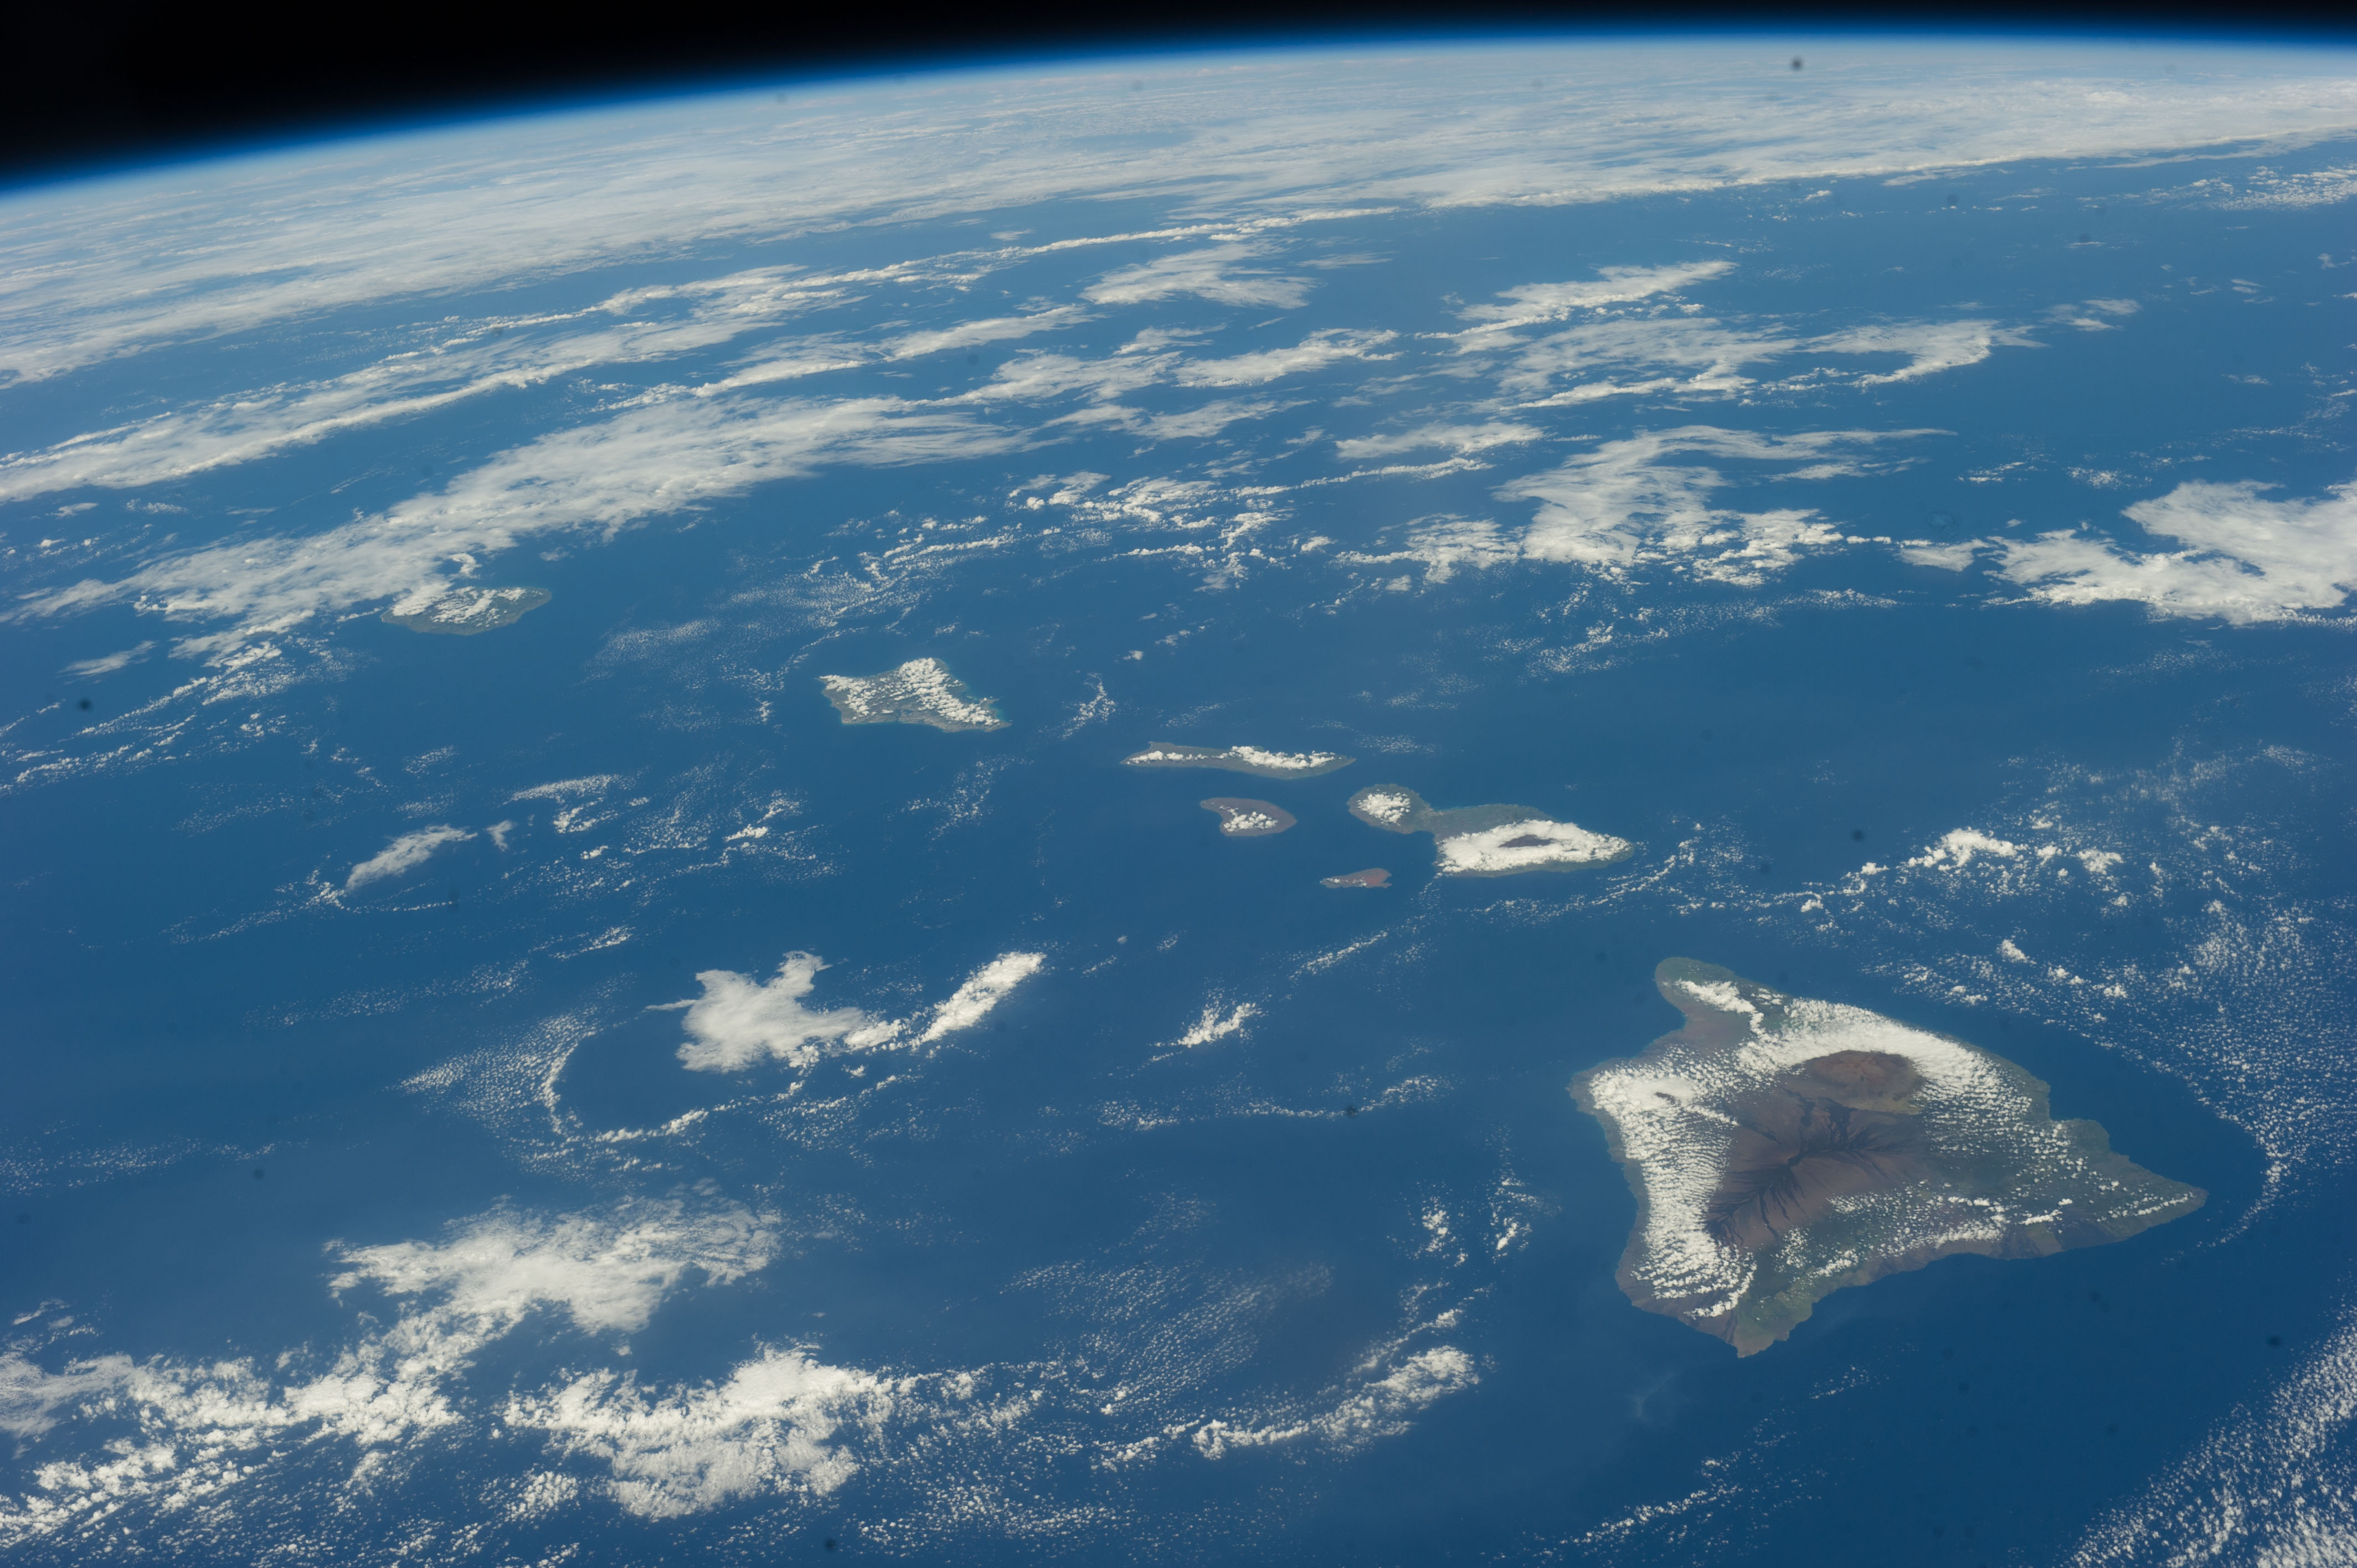
Transects across Hawaii (Crough 1983)
How are swells supported?
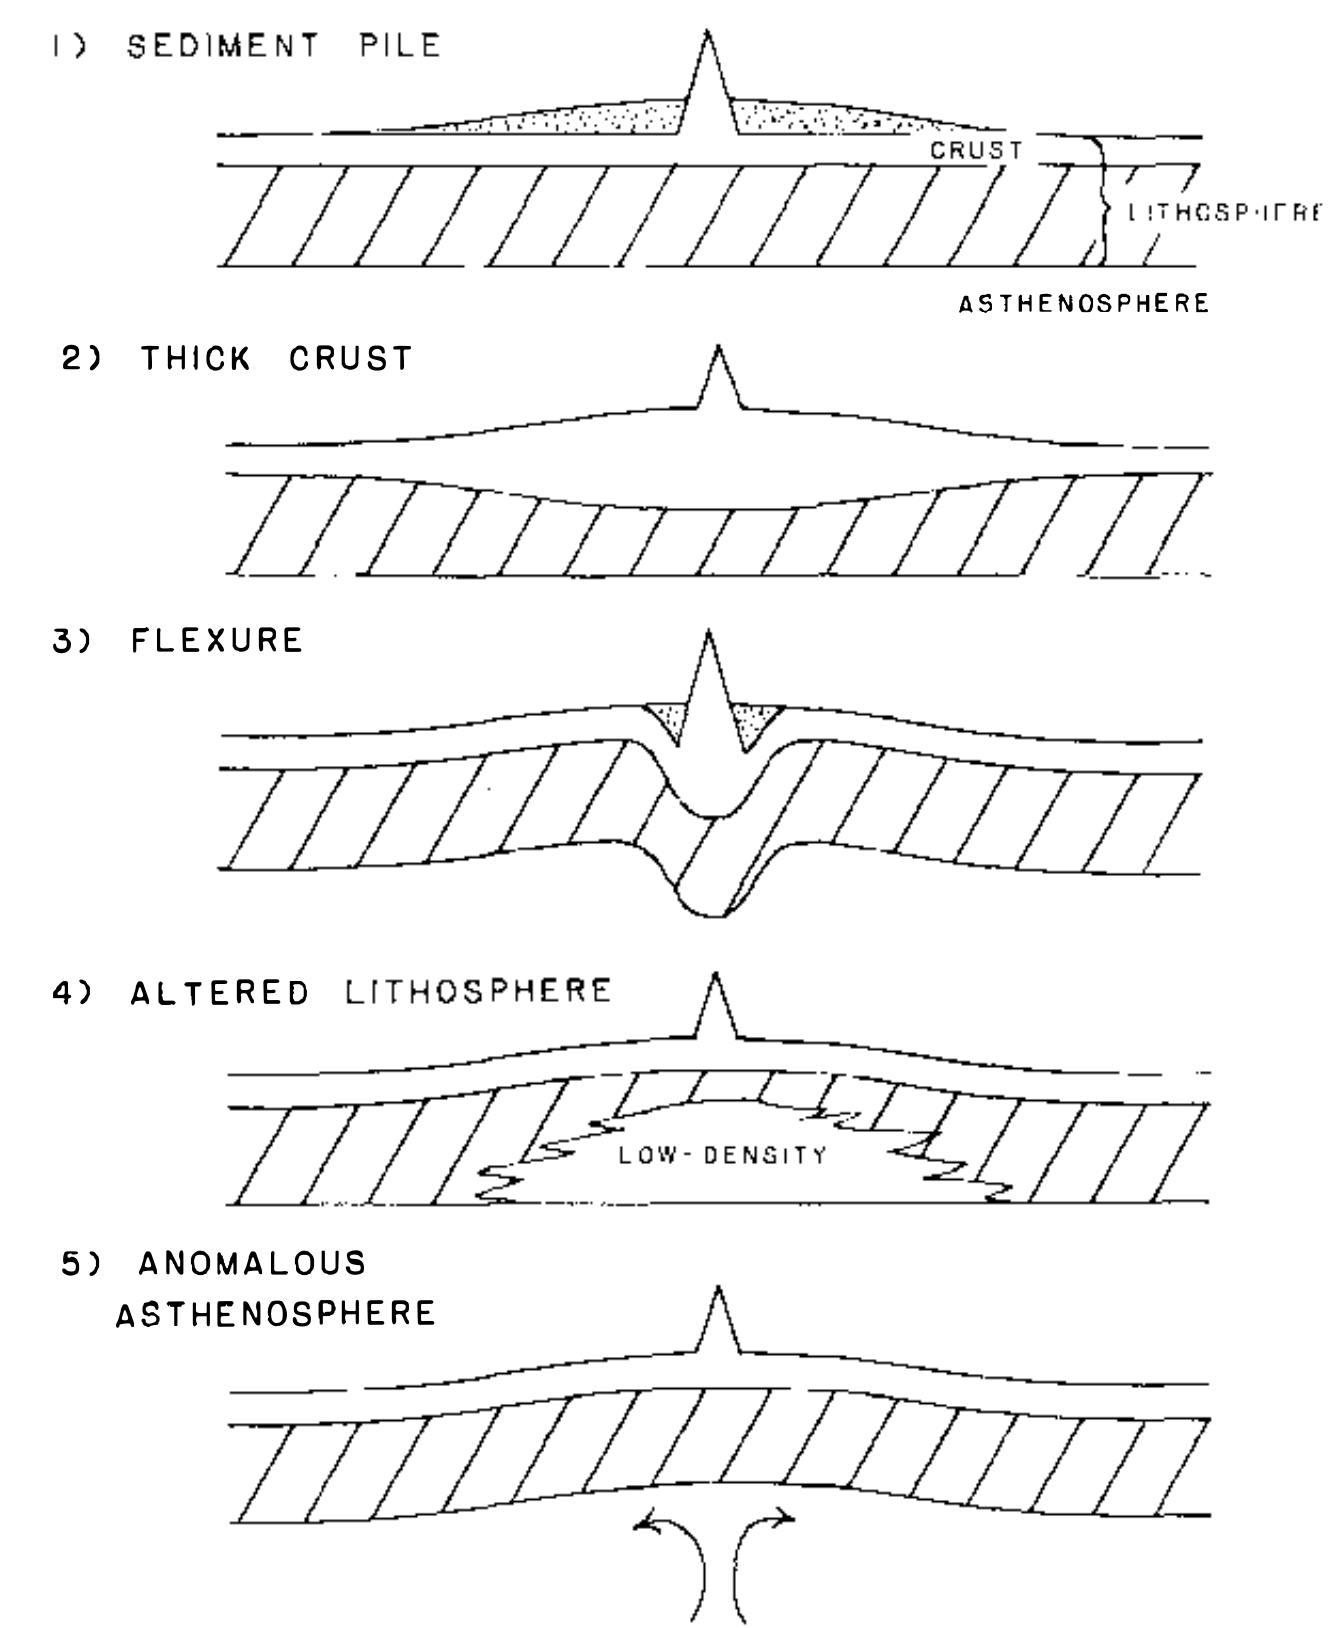
Constant crustal thickness
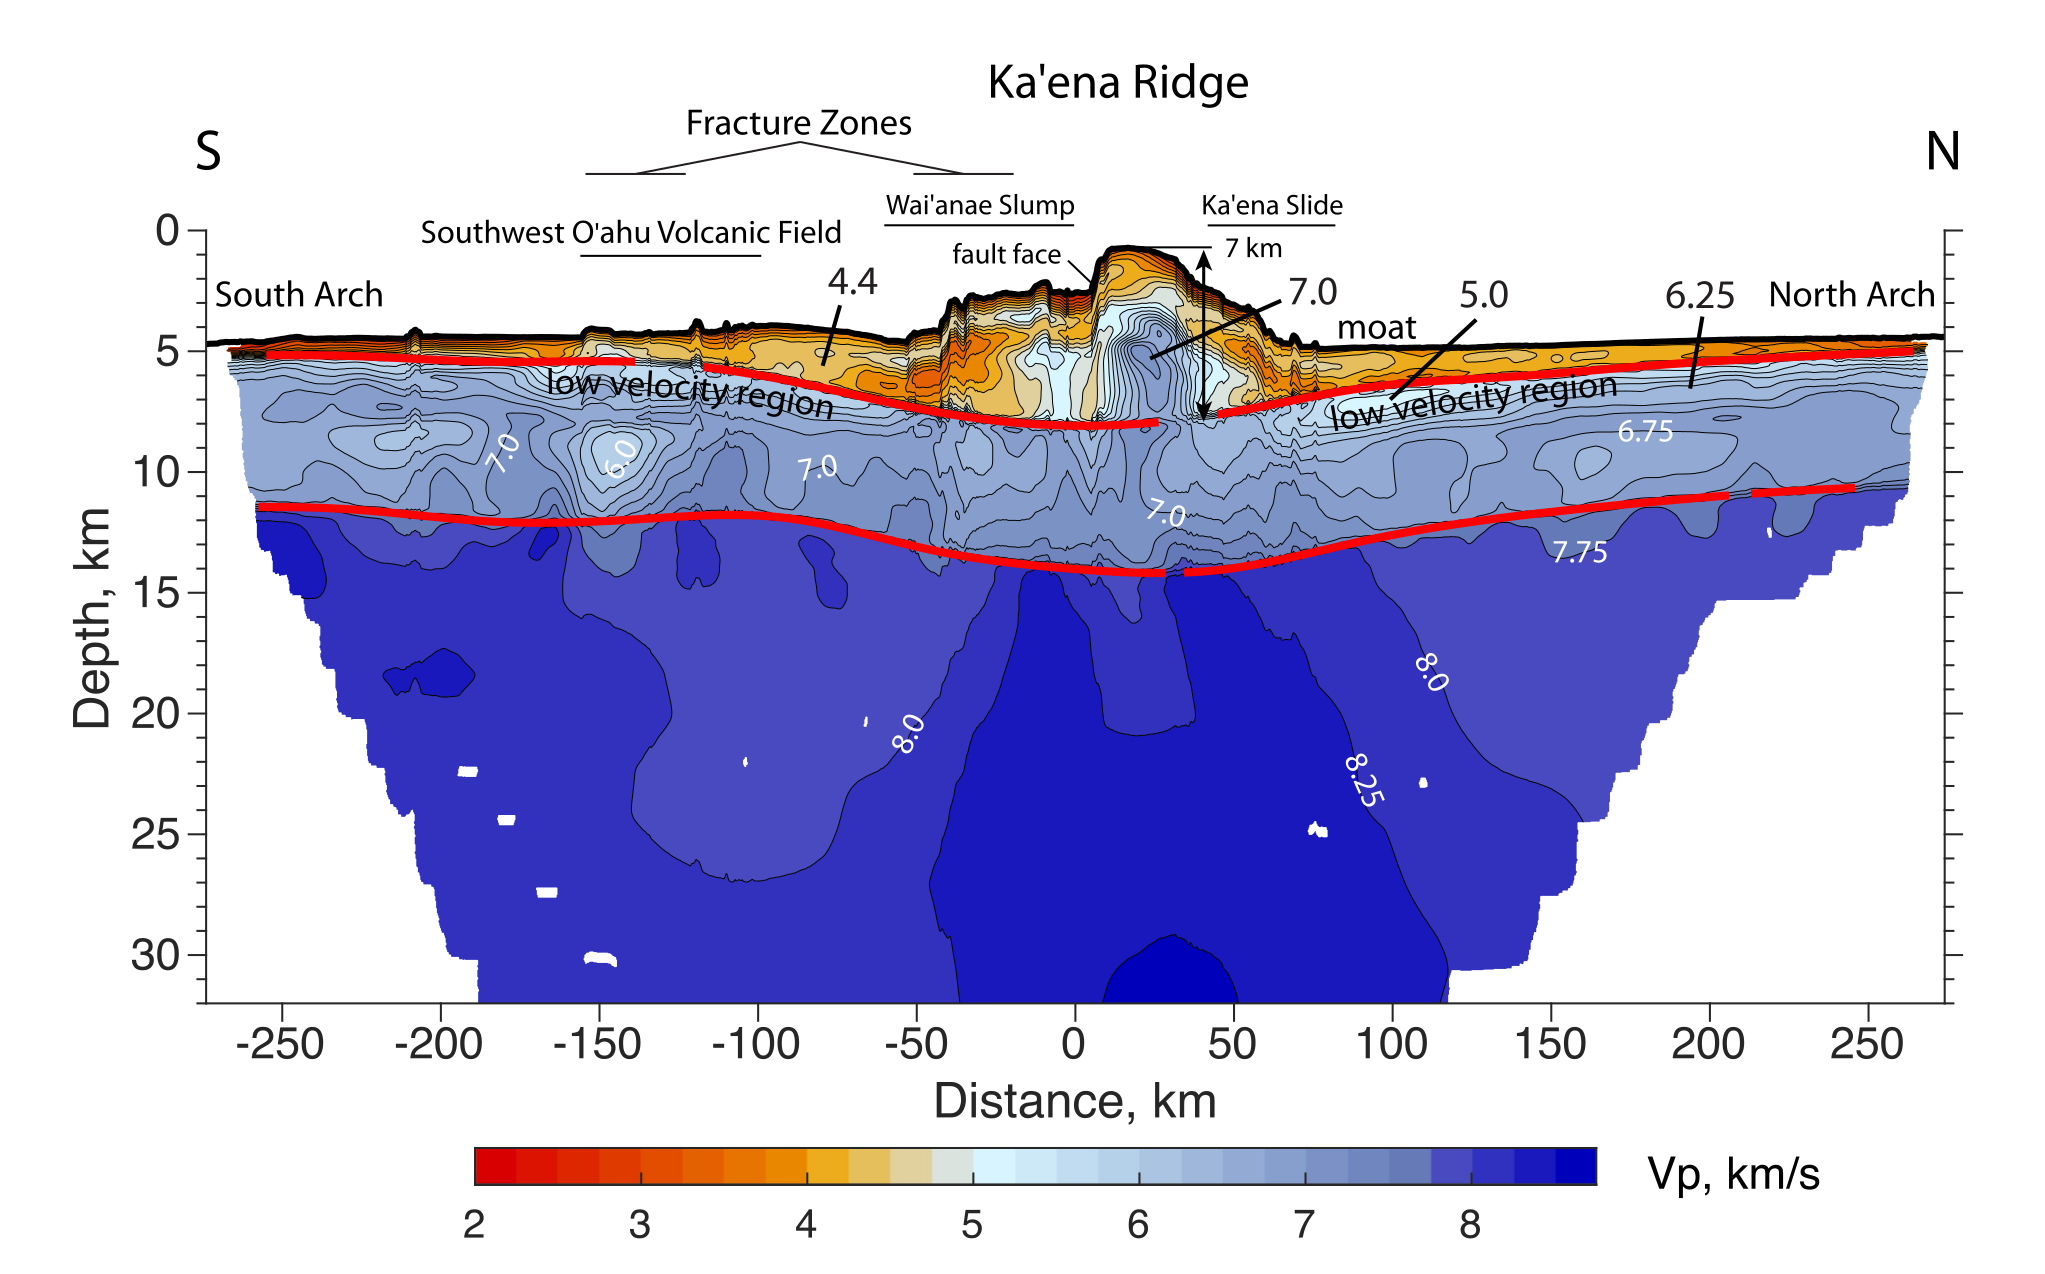
Dunn et. al. 2024
Are swells actually supported by thinner lithosphere?
Lee et. al. 2004
Are swells actually supported by thinner lithosphere?
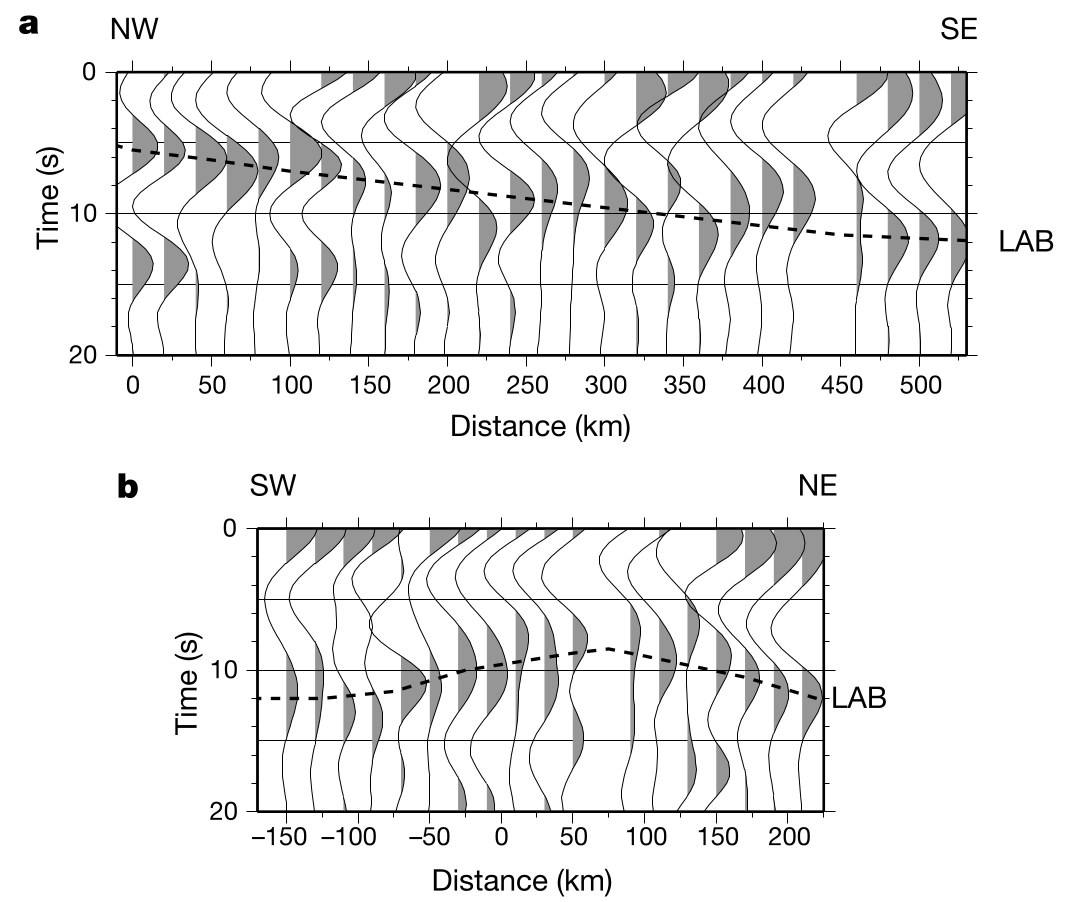
Lee et. al. 2004
Are swells actually supported by thinner lithosphere?
Lee et. al. 2004
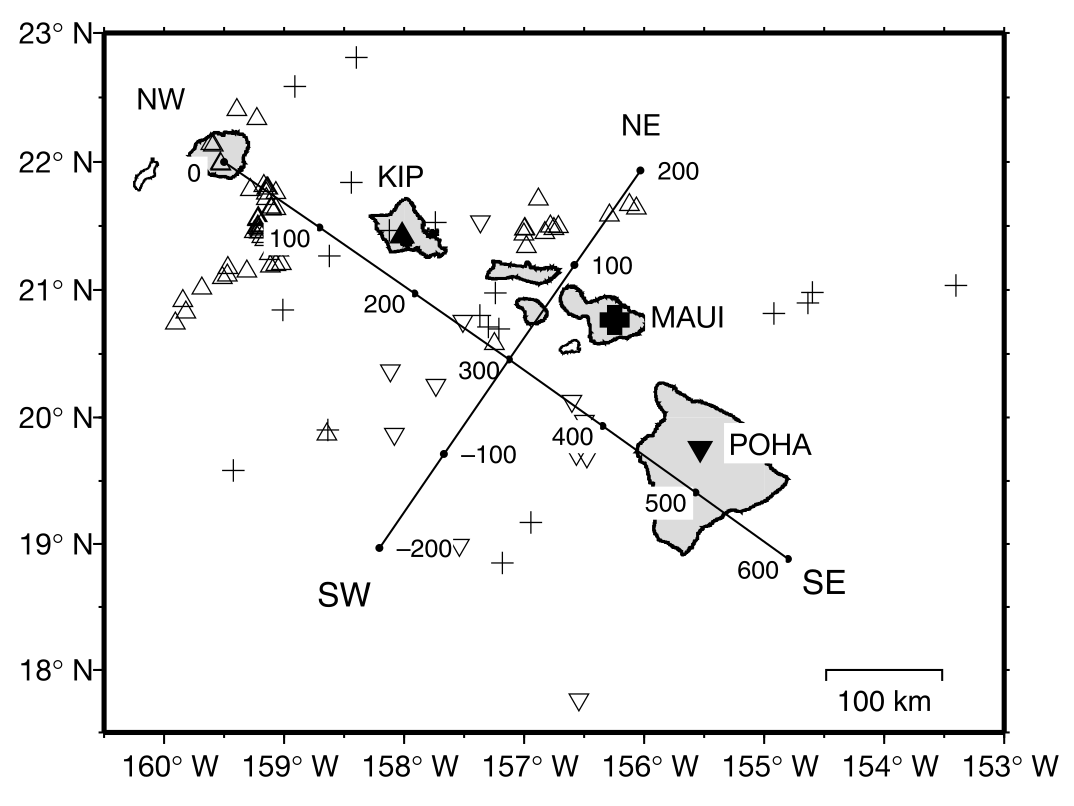
The PLUME experiment
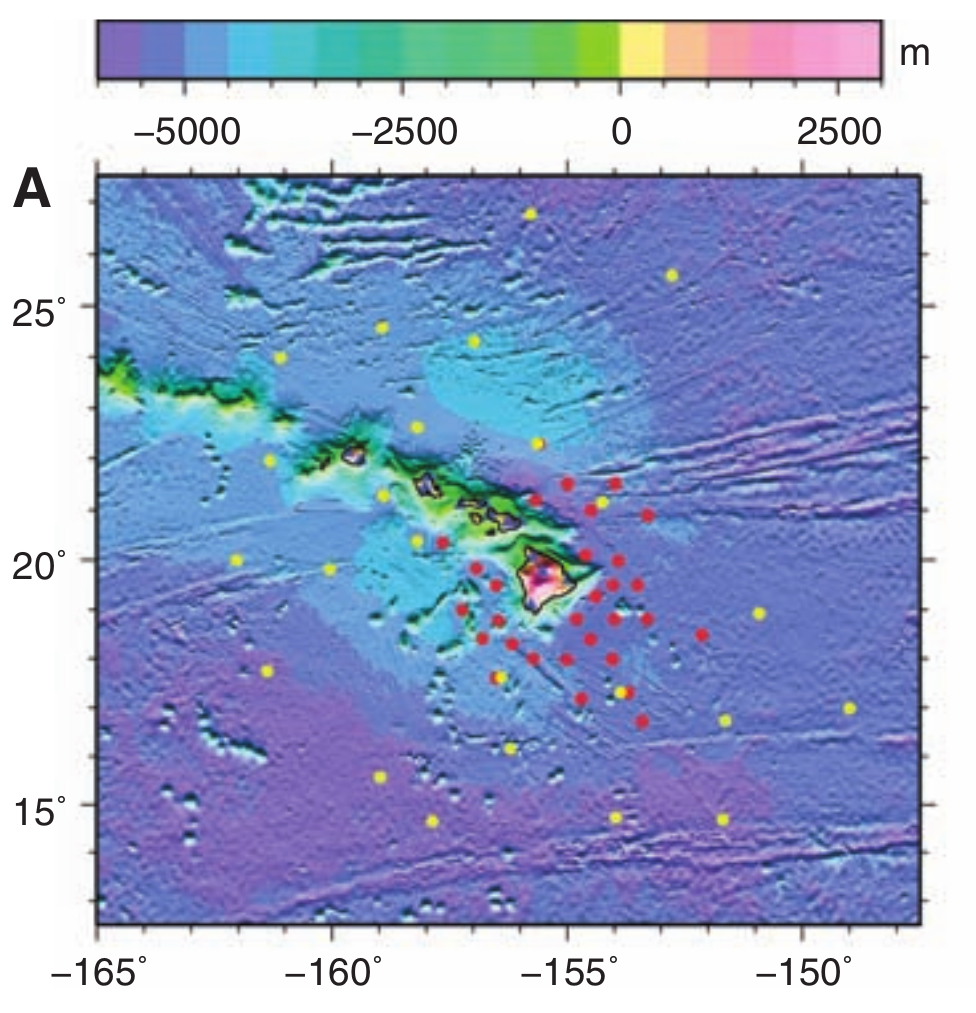
Seismic station network locations (Wolfe et. al. 2009)
The PLUME experiment
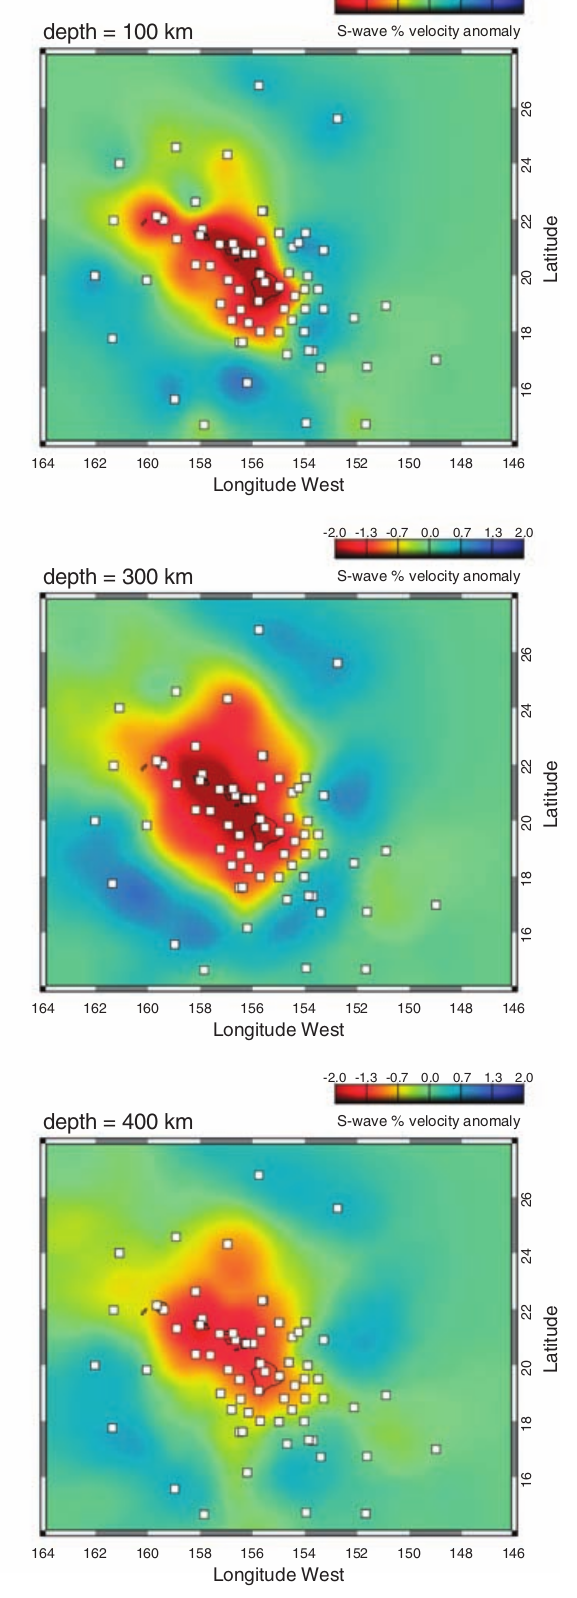
S-wave anomalies (Wolfe et. al. 2009)
The PLUME experiment

S-wave anomalies (Wolfe et. al. 2009)
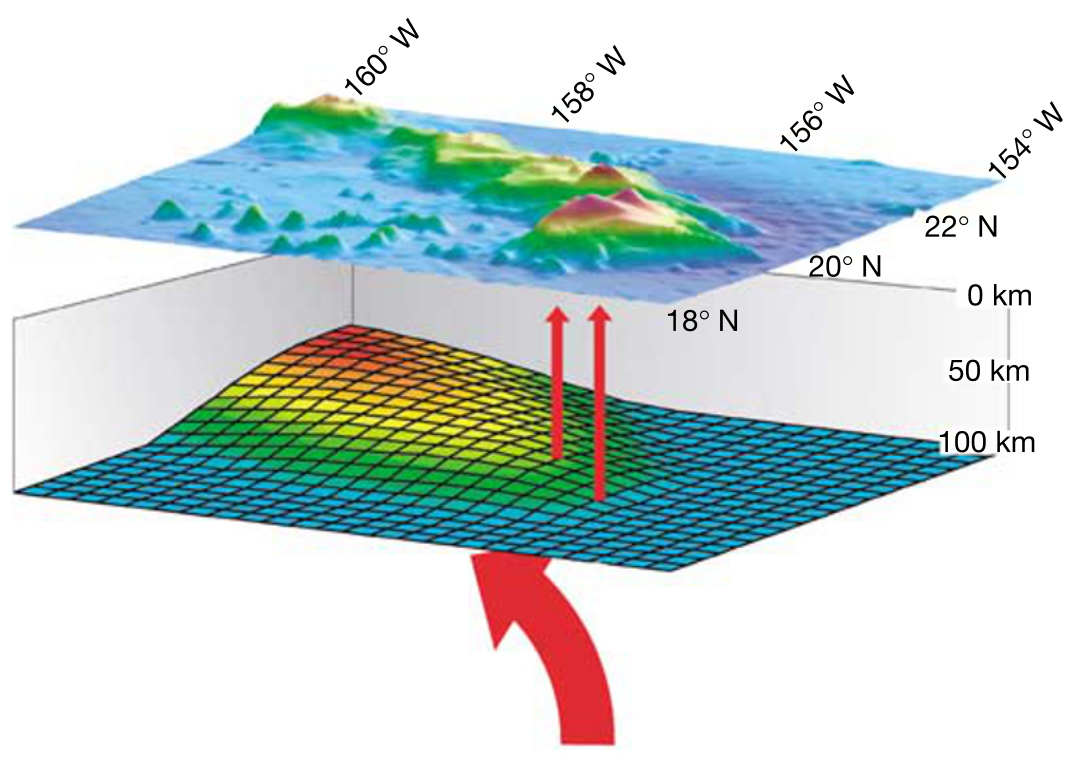
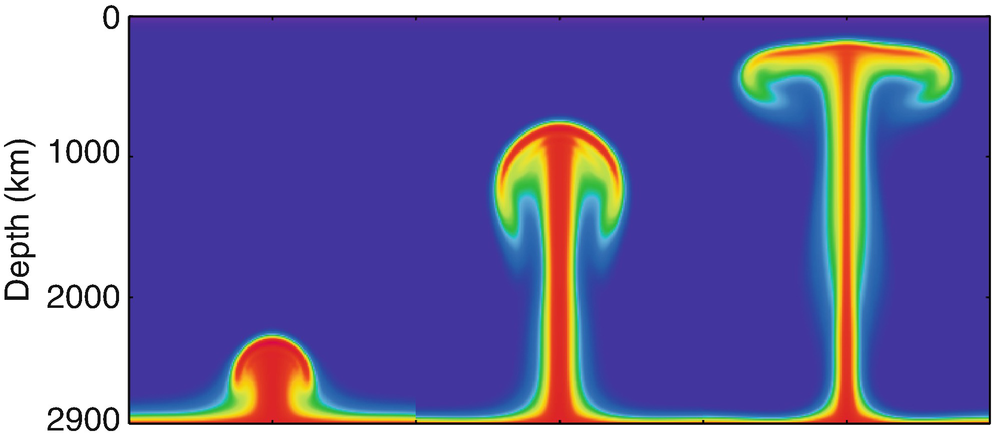
Thermal Plume simulations
Breaking the mold
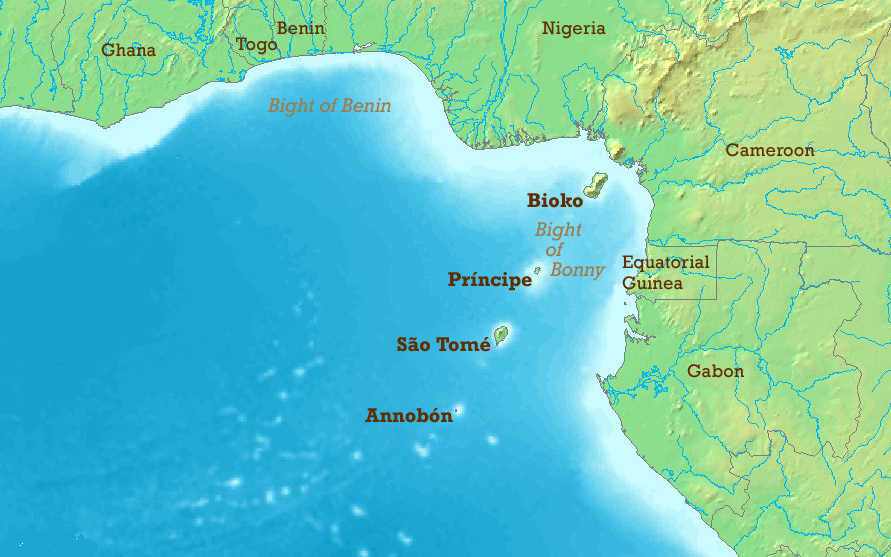
- Ages:
- Bioko: active
- Pricipe: ~6 Ma
- Sao Tome: ~1-3 Ma
- Continental volcanos: ~1-3 Ma
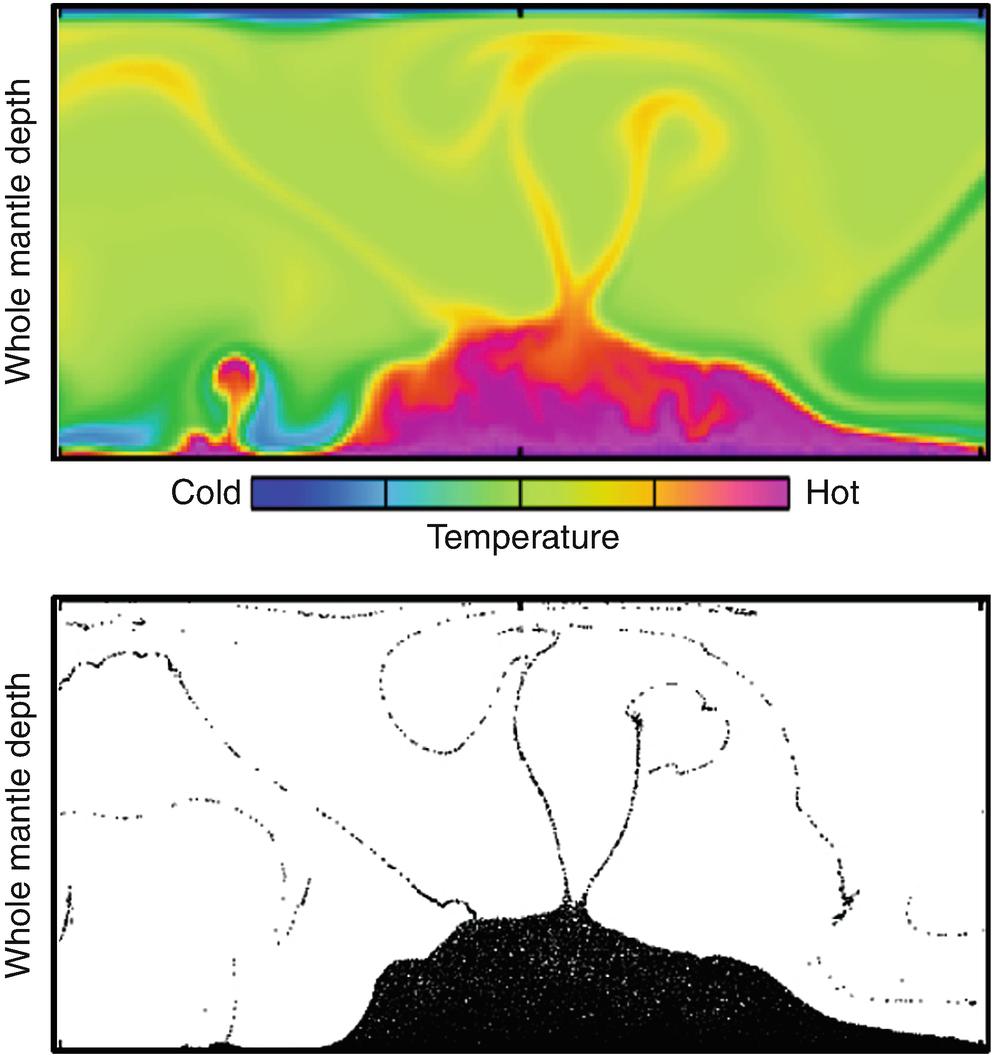
Thermochemical plumes
Are plumes stationary?
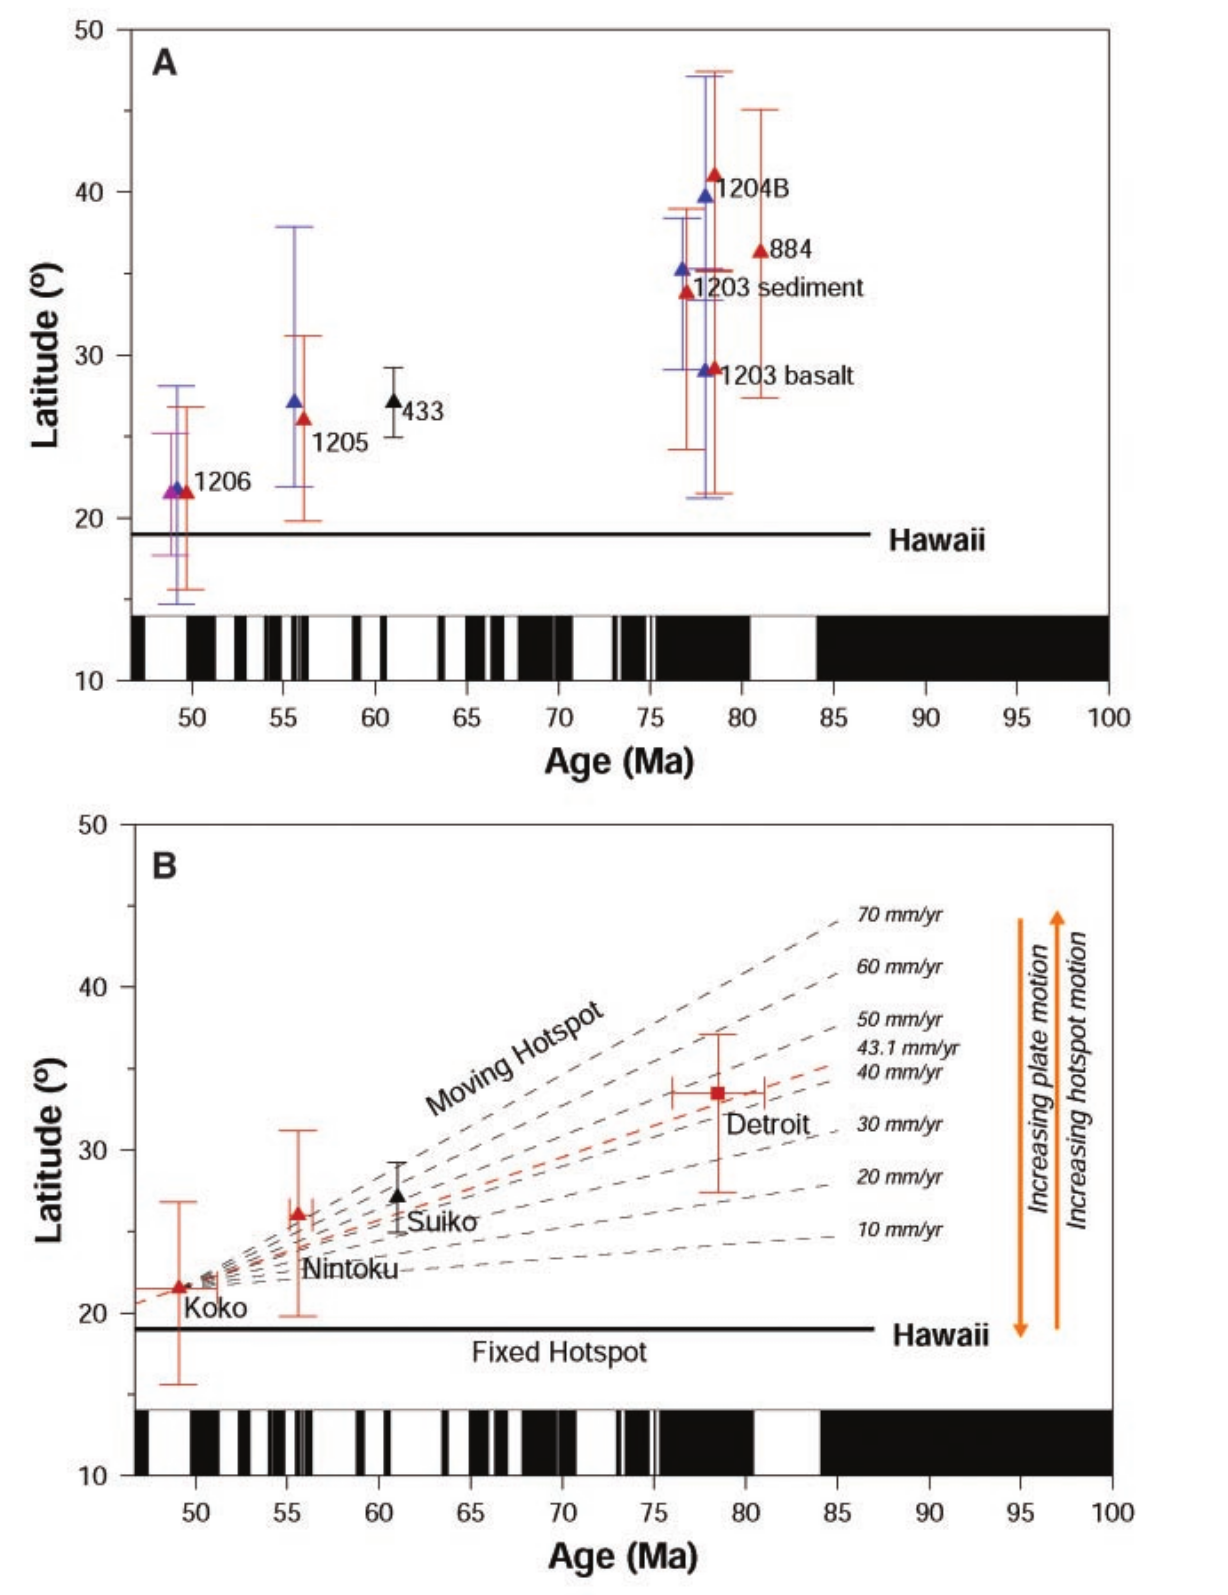
Tarduno et. al. 2003
Are plumes stationary?
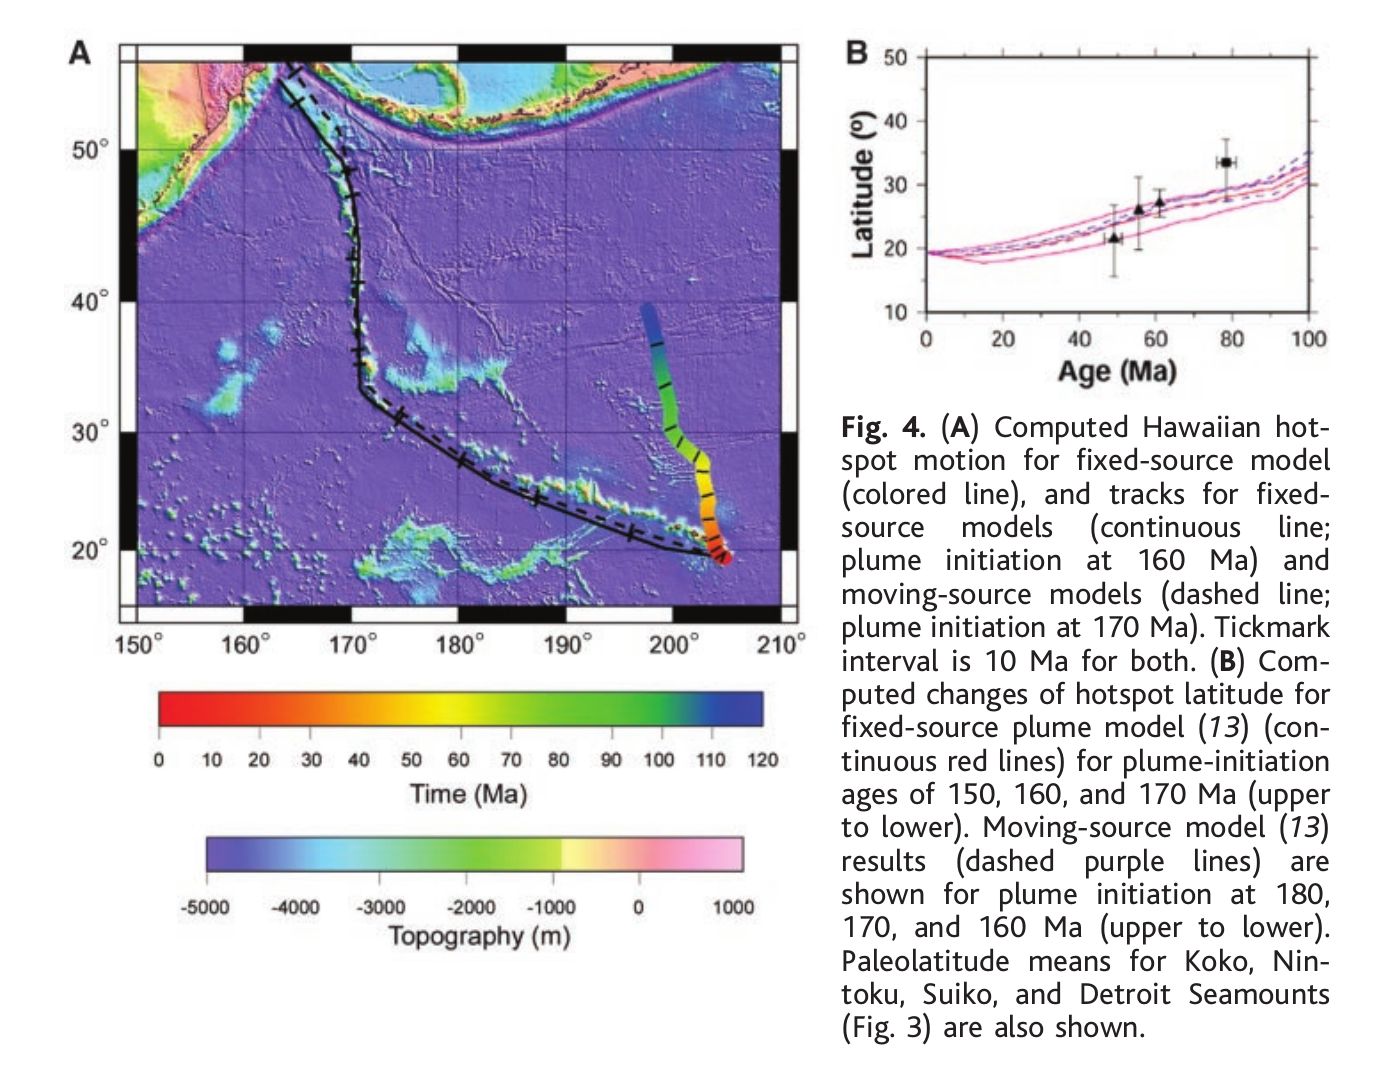
Tarduno et. al. 2003
Large igneous provinces and flood basalts
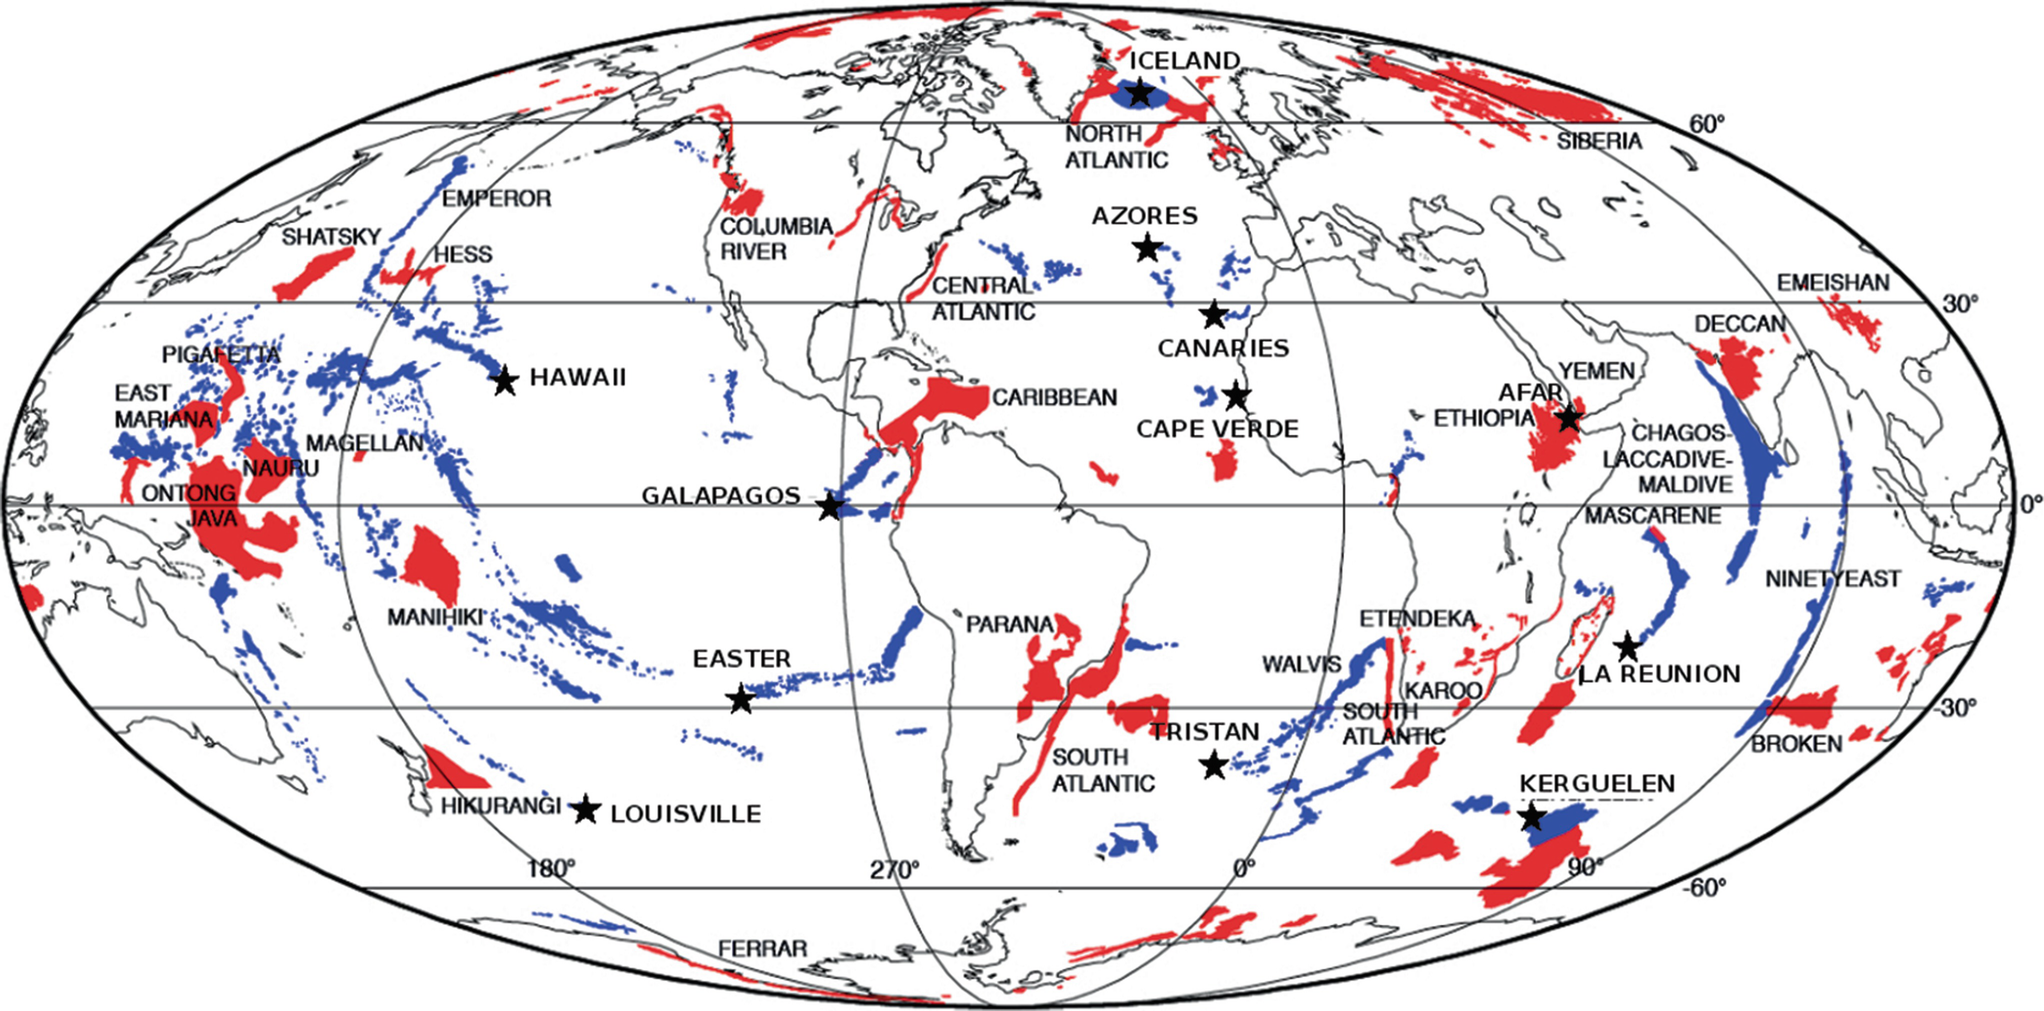
What can hotspots tell us about the mantle?
Are ridges passive or active?
- Ridges move with respect to a reference frame (what reference frame??)
- What happens when a ridge is offset by a transform fault?
- Challenges posed by these questions are solved if the ridge system is the result of spreading plates
- Melting is a passive process driven by spreading, not driven by hot sheets of rising mantle
Basalt chemistry tells us about process at depth: example from MORB
- Why would zero-age depth and chemistry correlate?
- Geochemistry review:
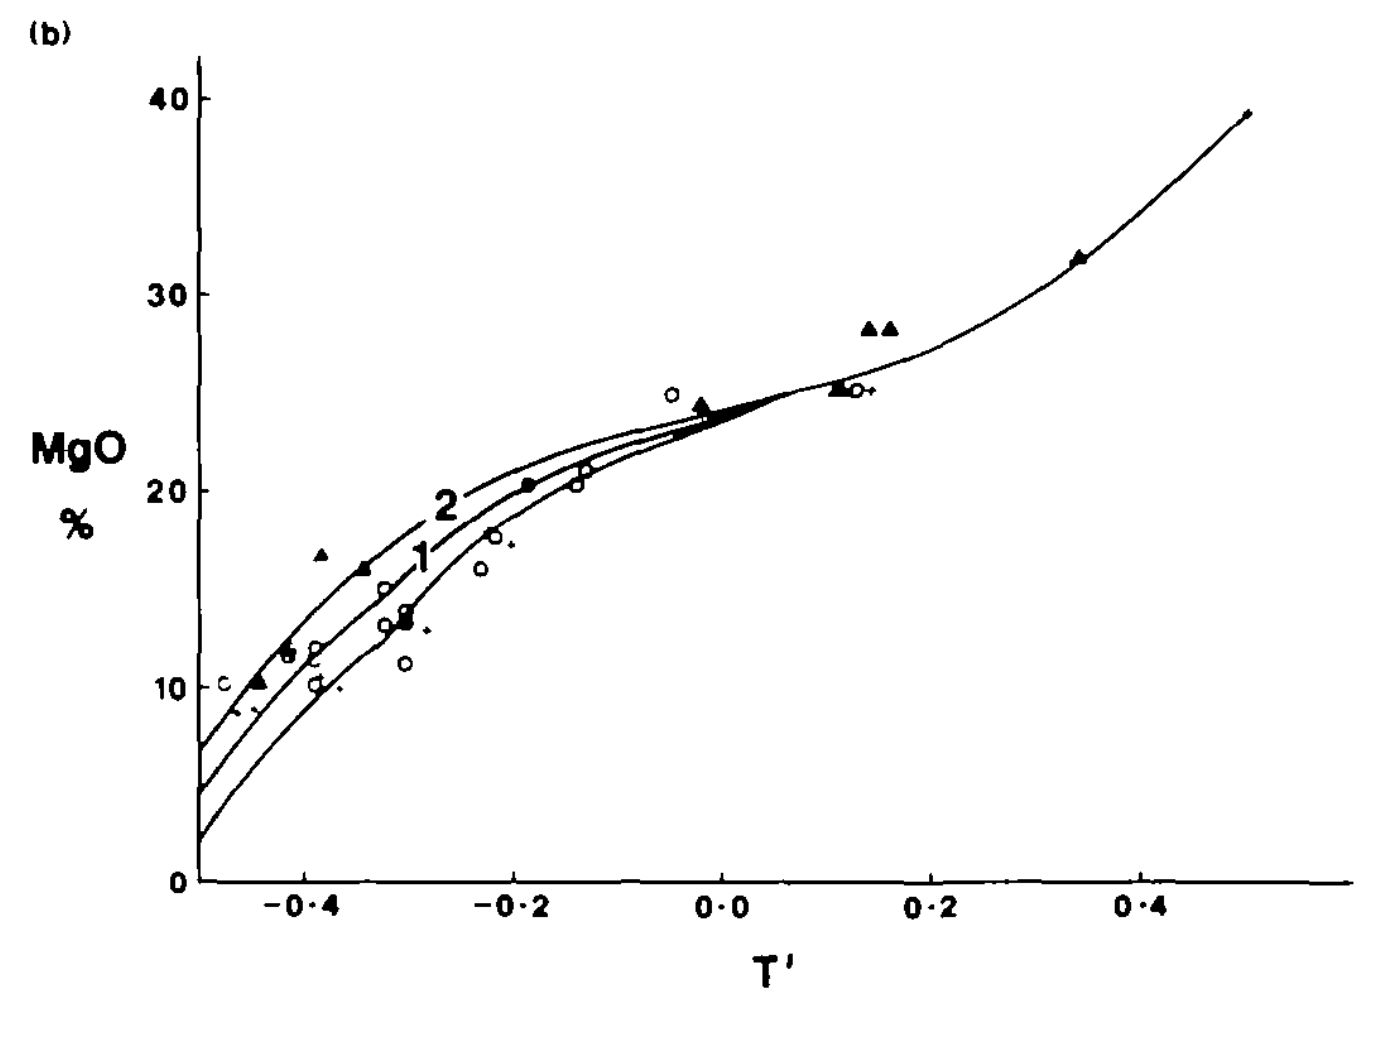
- What trends in MgO content of melt do you expect with increasing melt fraction? (think about minerals in peridotite)
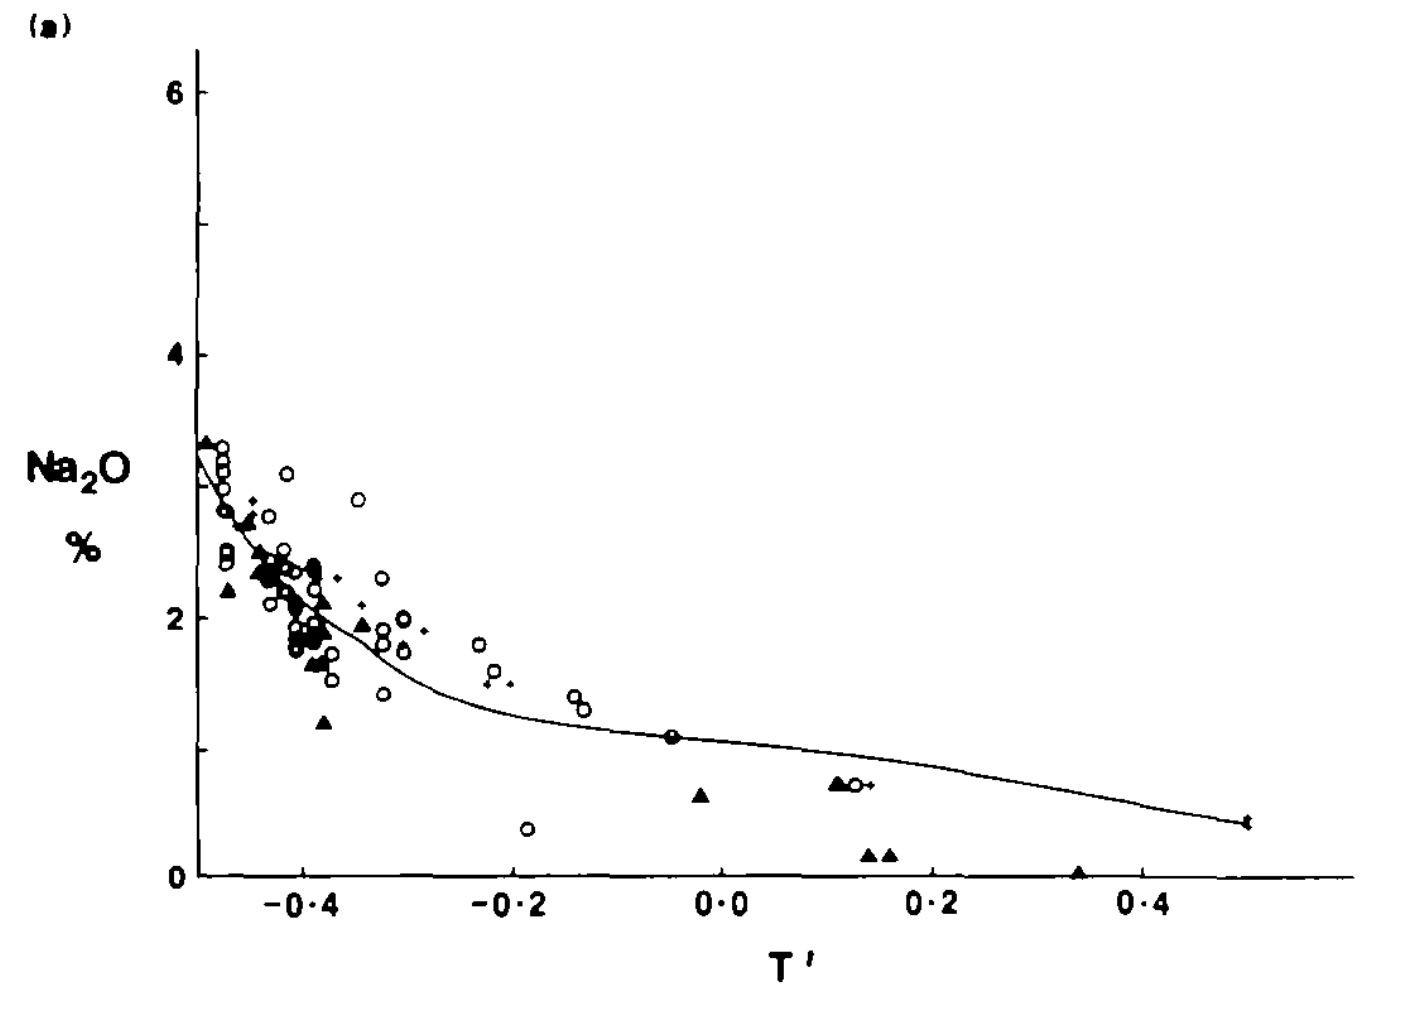
- What trends in NaO content of melt do you expect with increasing melt fraction? (sodium behaves like an incompatible trace element)
Potential temperatures
In our daily lives we have an intuitive understanding that a hot object generally has more heat content (enthalpy) than the same object after it cools. This intuition is less useful when considering materials on Earth (rocks, air, water) that are moving quickly across pressure gradients.
The first law of thermodynamics can be stated as:
\begin{equation} \begin{gathered} & dQ & = &~dU~& + &~PdV & \\ & change~in~heat~ & = & ~change~in~internal~energy~& + &~work~done~on~the~environment & \end{gathered} \end{equation}where $dV$ is the change in volume, and $P$ is the pressure. When considering adiabatic processes, where there is no change in heat, $dQ=0$, we find that the temperature of a material changes due to work done by the system.
\begin{equation} \begin{gathered} & dQ & = &~dU~& + &~PdV & \\ & 0 & = &~C_vdT~& + &~PdV & \\ & & &~C_vdT~& = &~-PdV & \\ \end{gathered} \end{equation}$C_v$ = heat capacity at constant volume
Potential temperatures
\begin{equation} \begin{gathered} & dQ & = &~dU~& + &~PdV & \\ & 0 & = &~C_vdT~& + &~PdV & \\ & & &~C_vdT~& = &~-PdV & \\ \end{gathered} \end{equation}So when the volume change is positive (expansion), dT must be negative (cooling). Alternatively if we considered the case of constant volume, using $PdV = - \frac{VdP}{\gamma}$, then decreases in pressure lead to decreases in temperature ($\gamma$ is a positive ratio of the specific heat for the material at constant pressure and constant volume).
The potential temperature, $T_p$, is the temperature defined at a reference pressure, and it allows us to use our daily intuition about temperature when considering the energy (heat content) in a parcel of rock, water, or air. Potential temperatures of the mantle control the starting point for melting during adiabatic decompression.
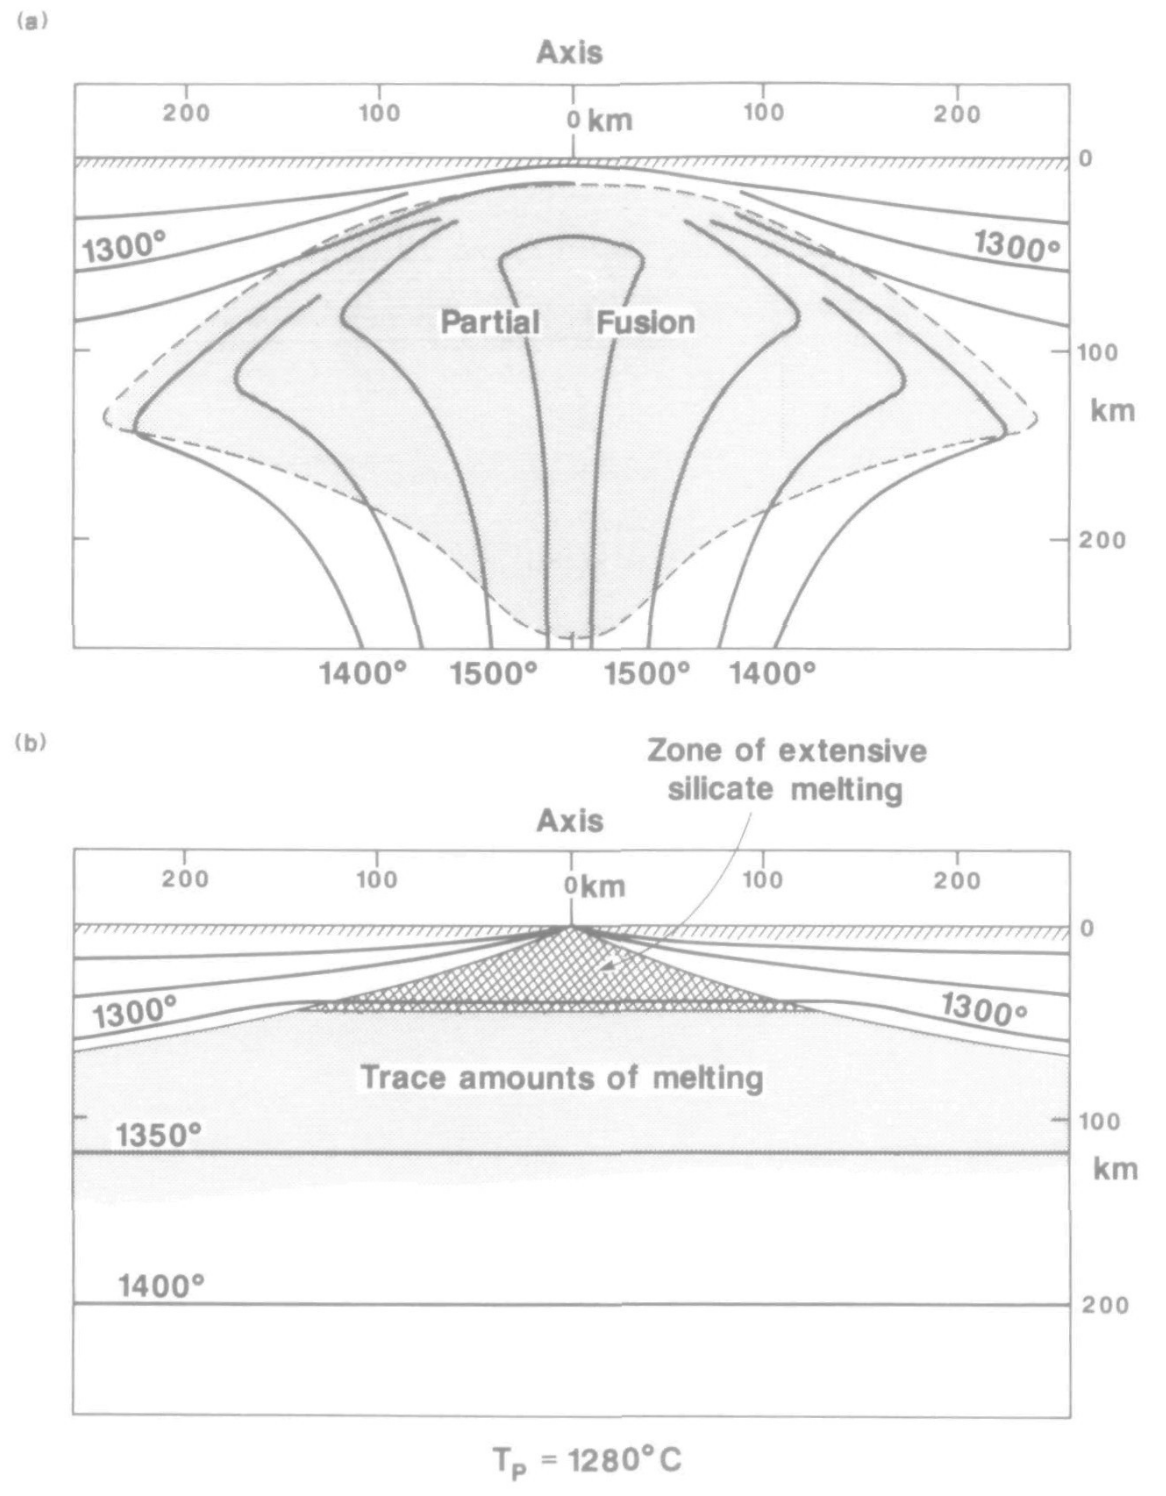
Axial depth, crustal thickness, and melting
Melting peridotite
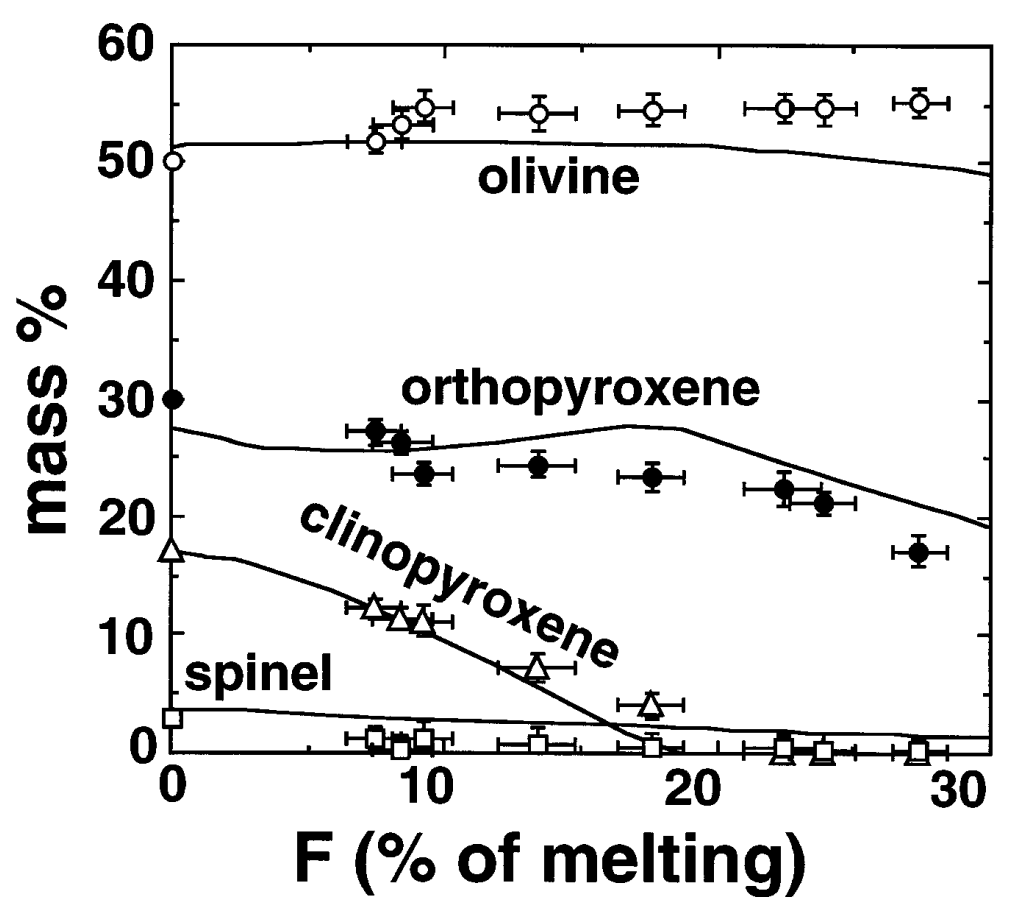
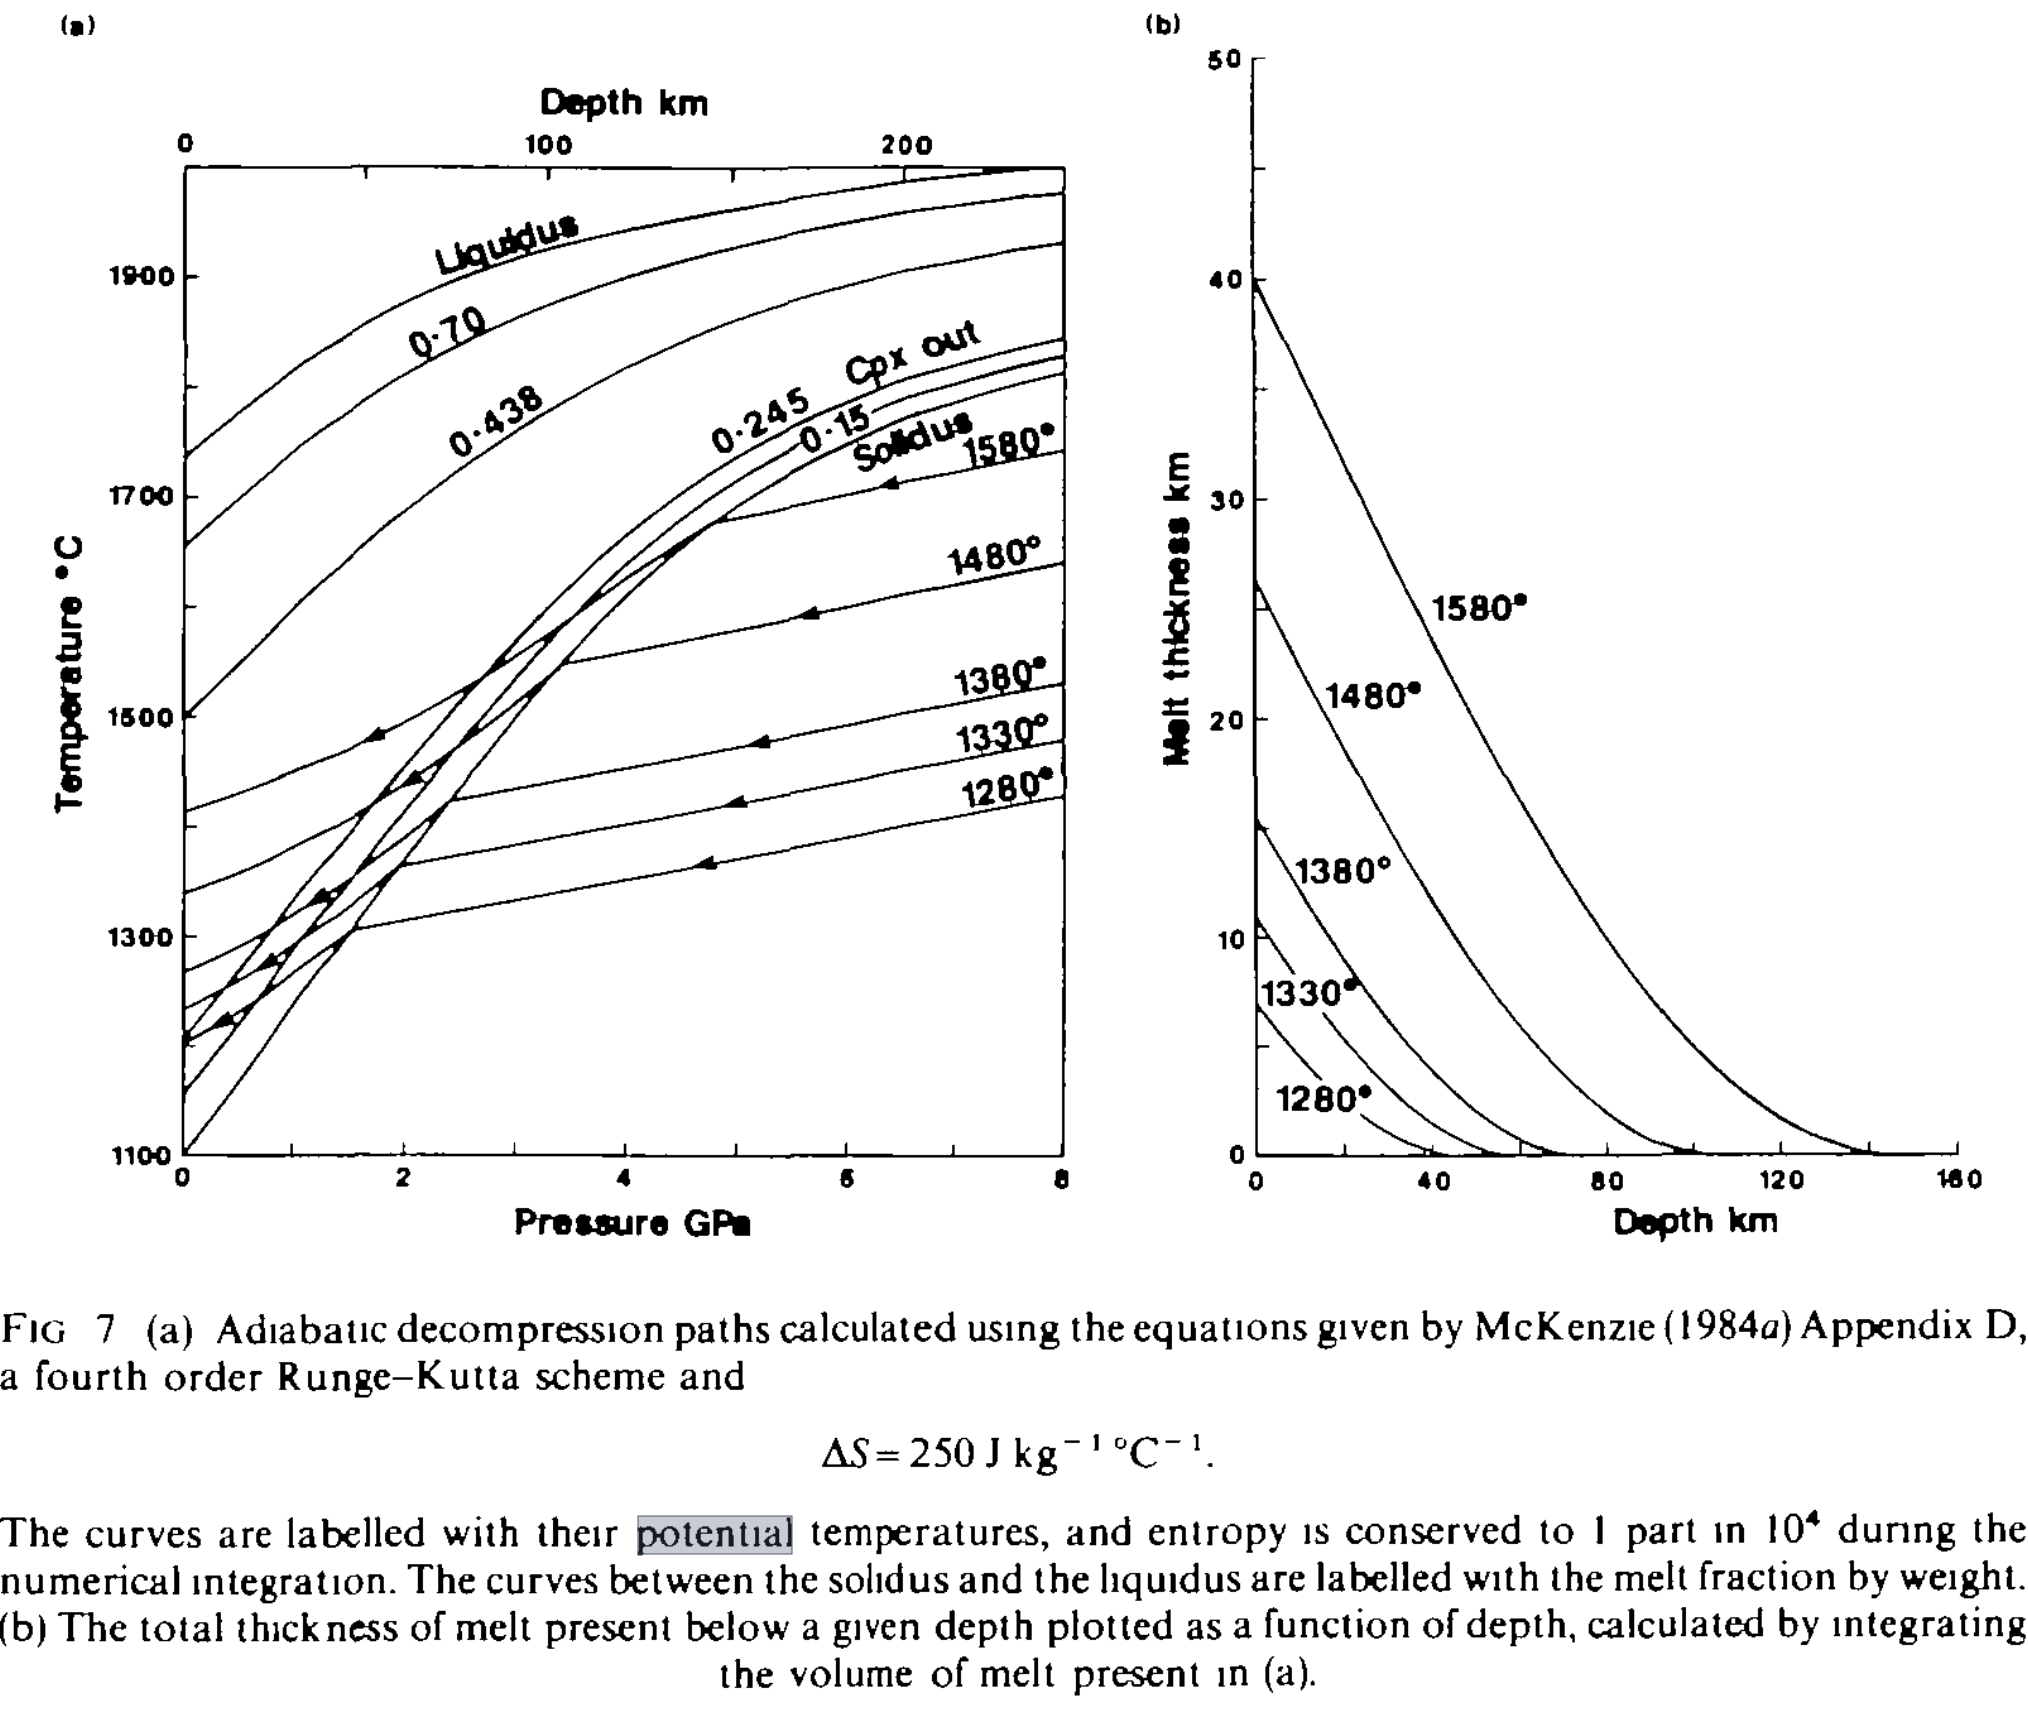
Peridotite melting experiments
(-0.5 is the solidus, 0.5 is the liquidus)
Peridotite melting experiments
(-0.5 is the solidus, 0.5 is the liquidus)