Lecture 9: Stratigraphic time part II
- Correlative surfaces
- Chronostratigraphy (Wheeler diagrams)
- Time in the rock record
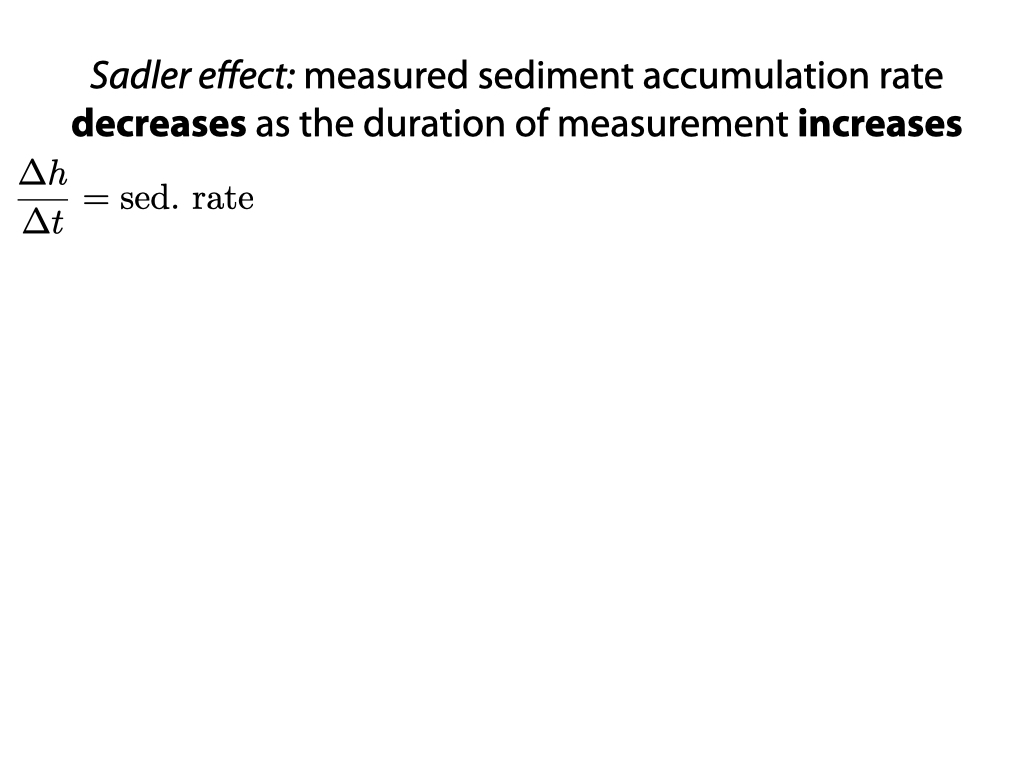
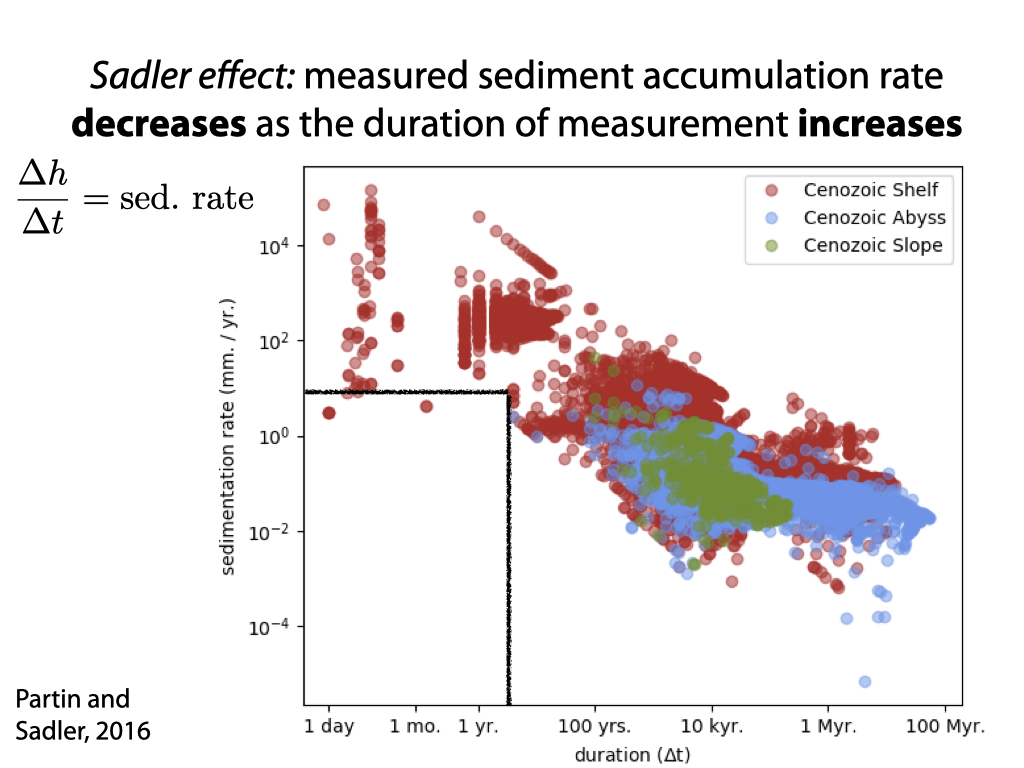
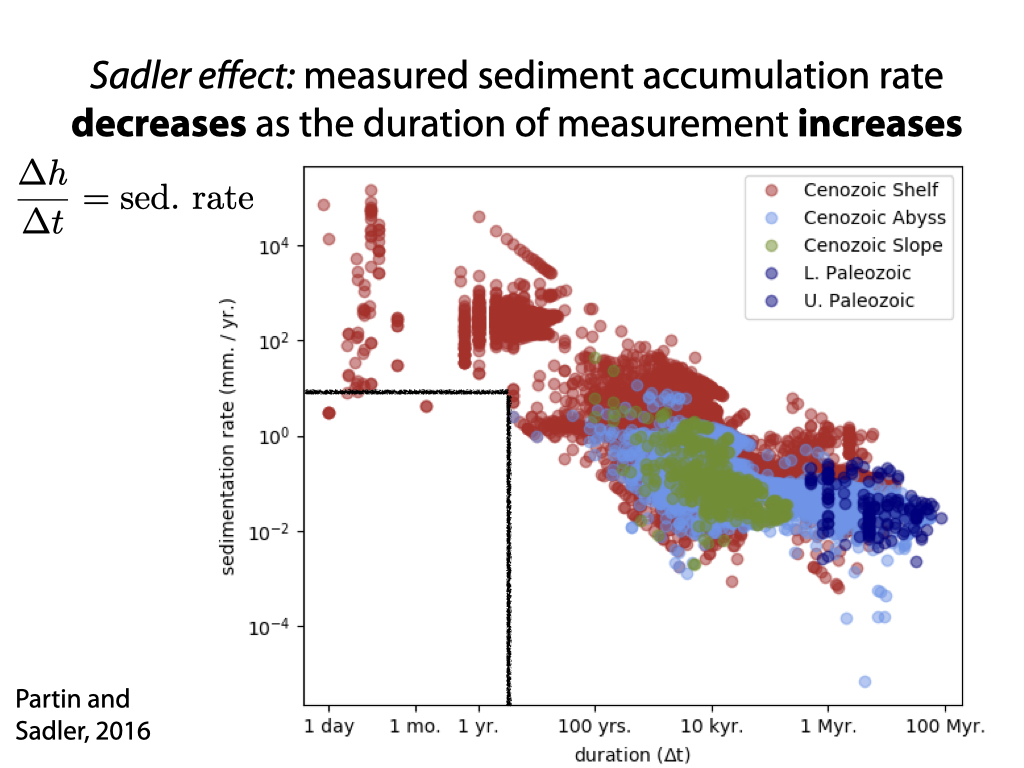
- Sadler effect
- Cyclostratigraphy
We acknowledge and respect the lək̓ʷəŋən peoples on whose traditional territory the university stands and the Songhees, Esquimalt and W̱SÁNEĆ peoples whose historical relationships with the land continue to this day.
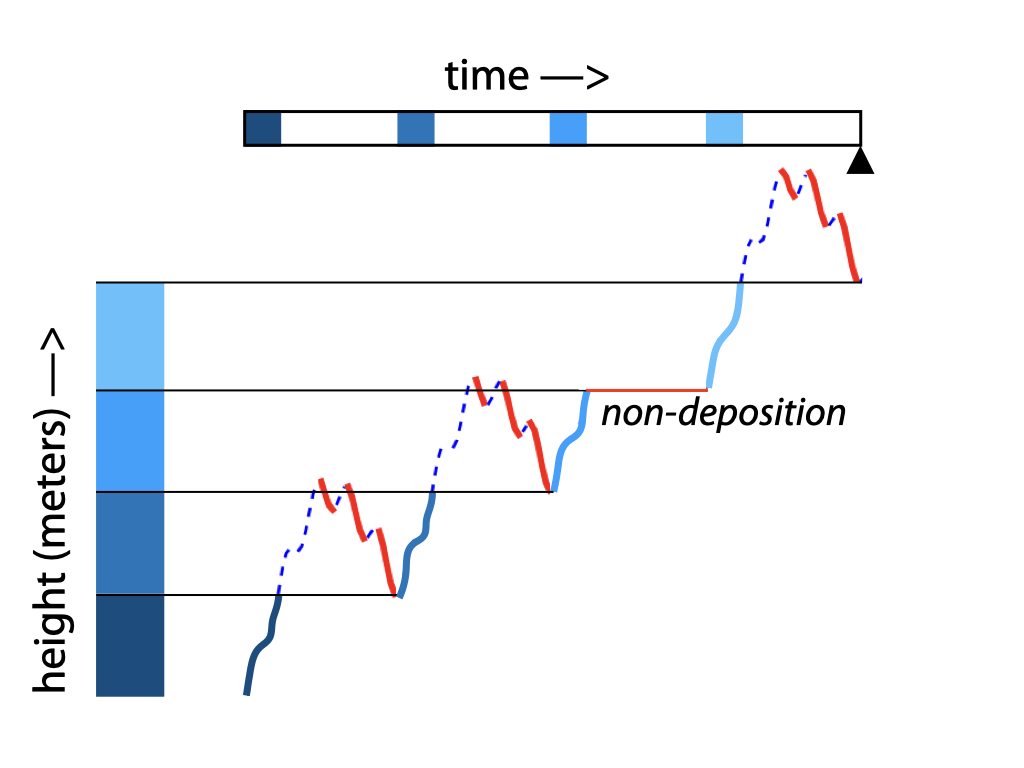
On/Off sediment supply with constant subsidence: time vs topography
On/Off sediment supply with constant subsidence: time vs topography
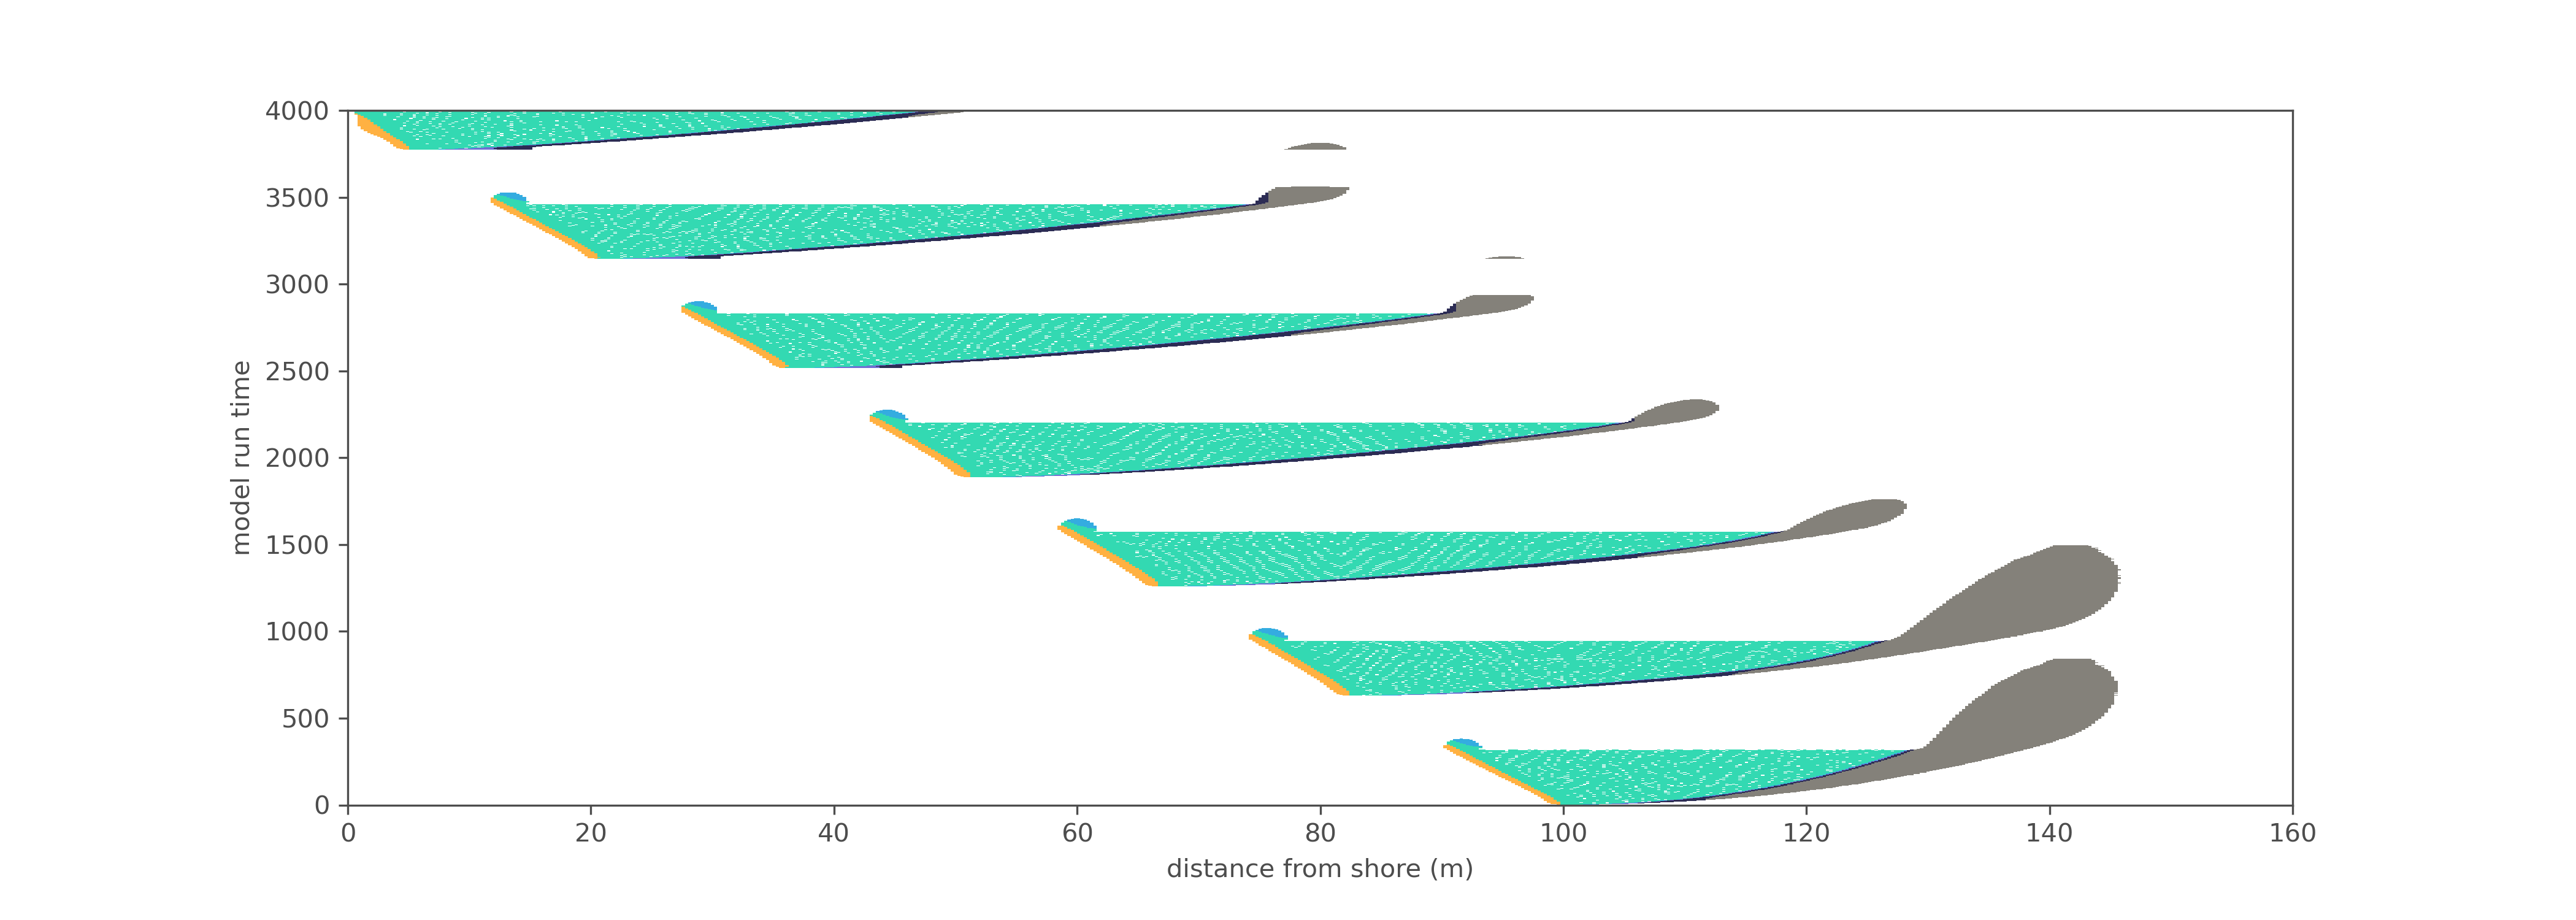
On/Off sediment supply with constant subsidence: time vs topography (erosion)
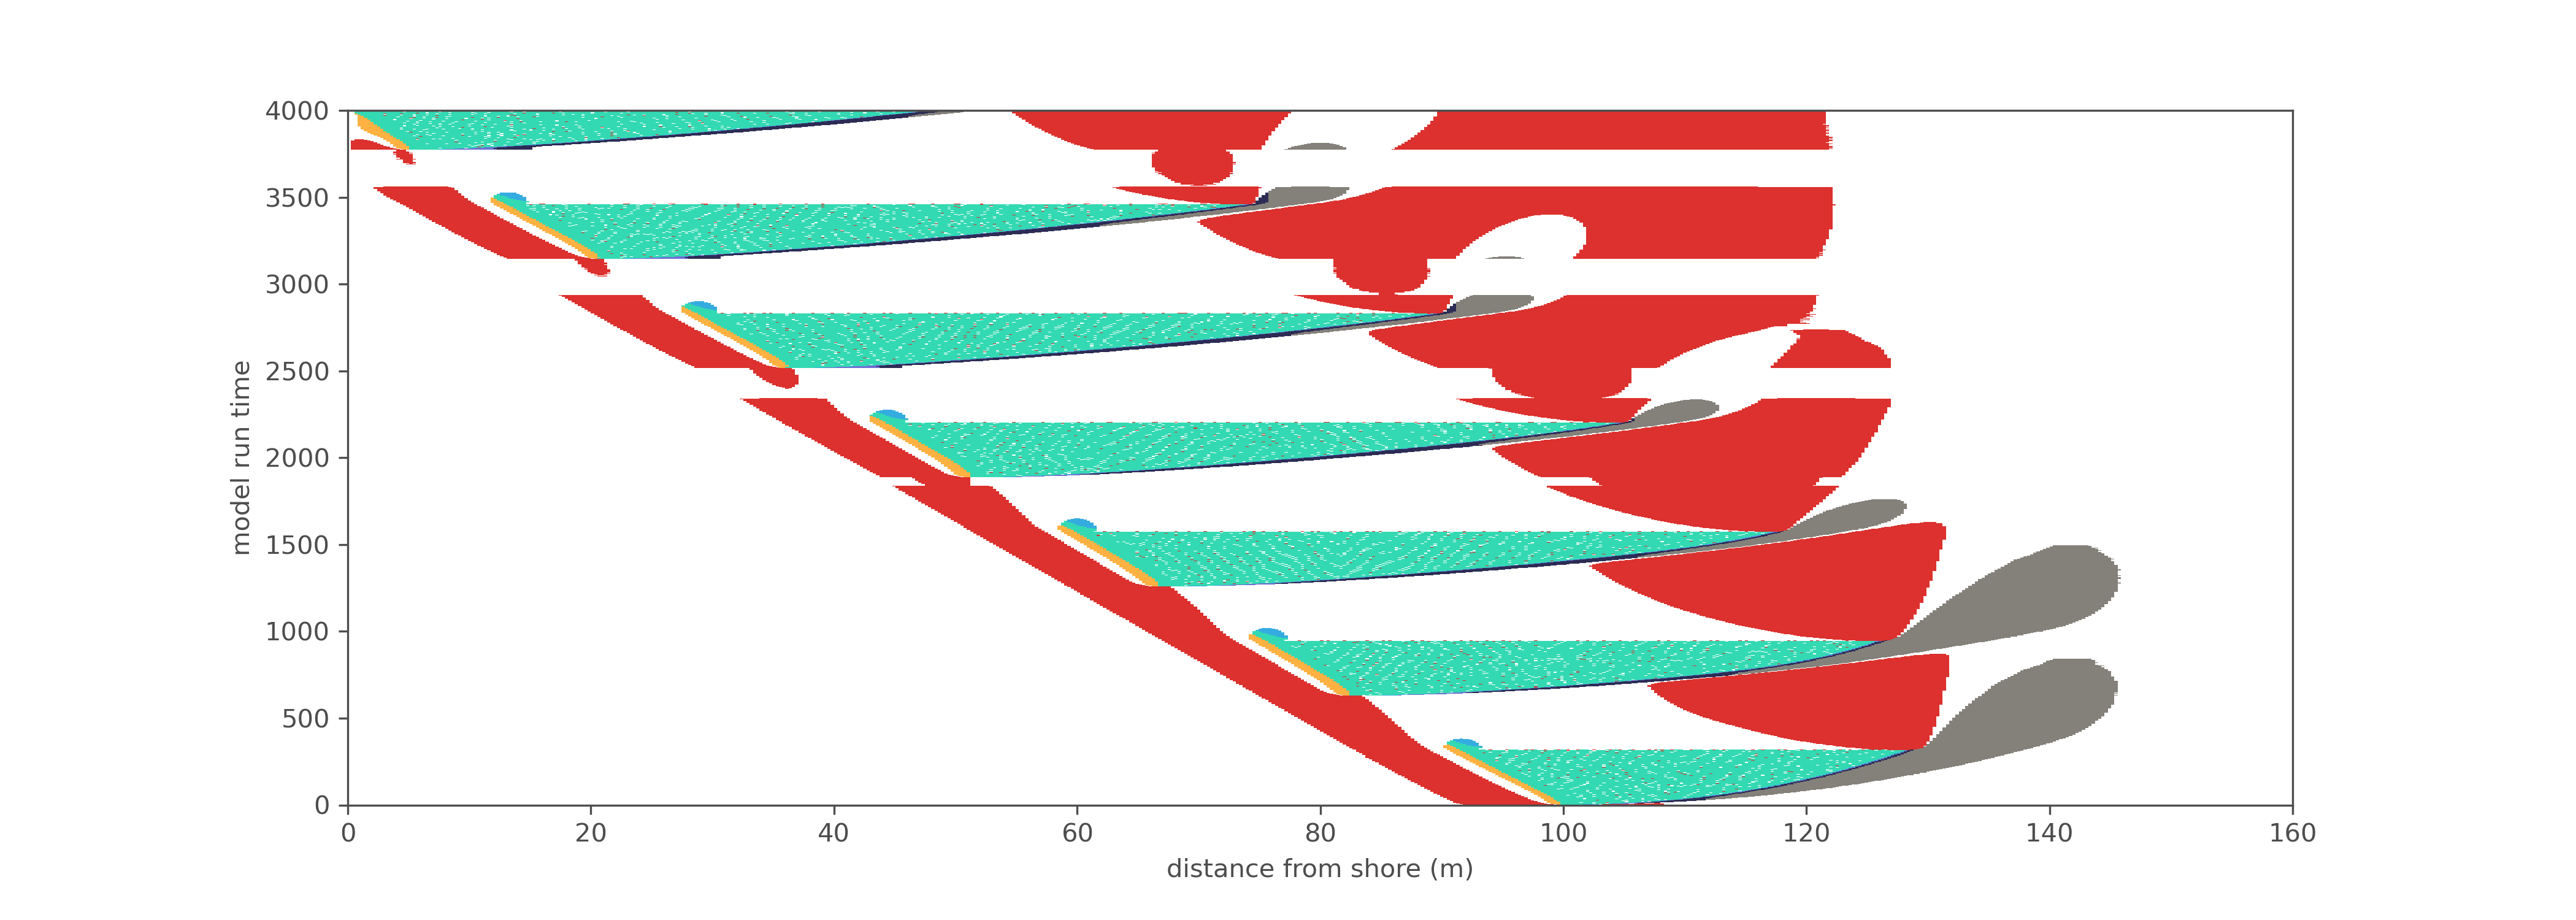
On/Off sediment supply with constant subsidence: time vs topography (erosion and hiatus)
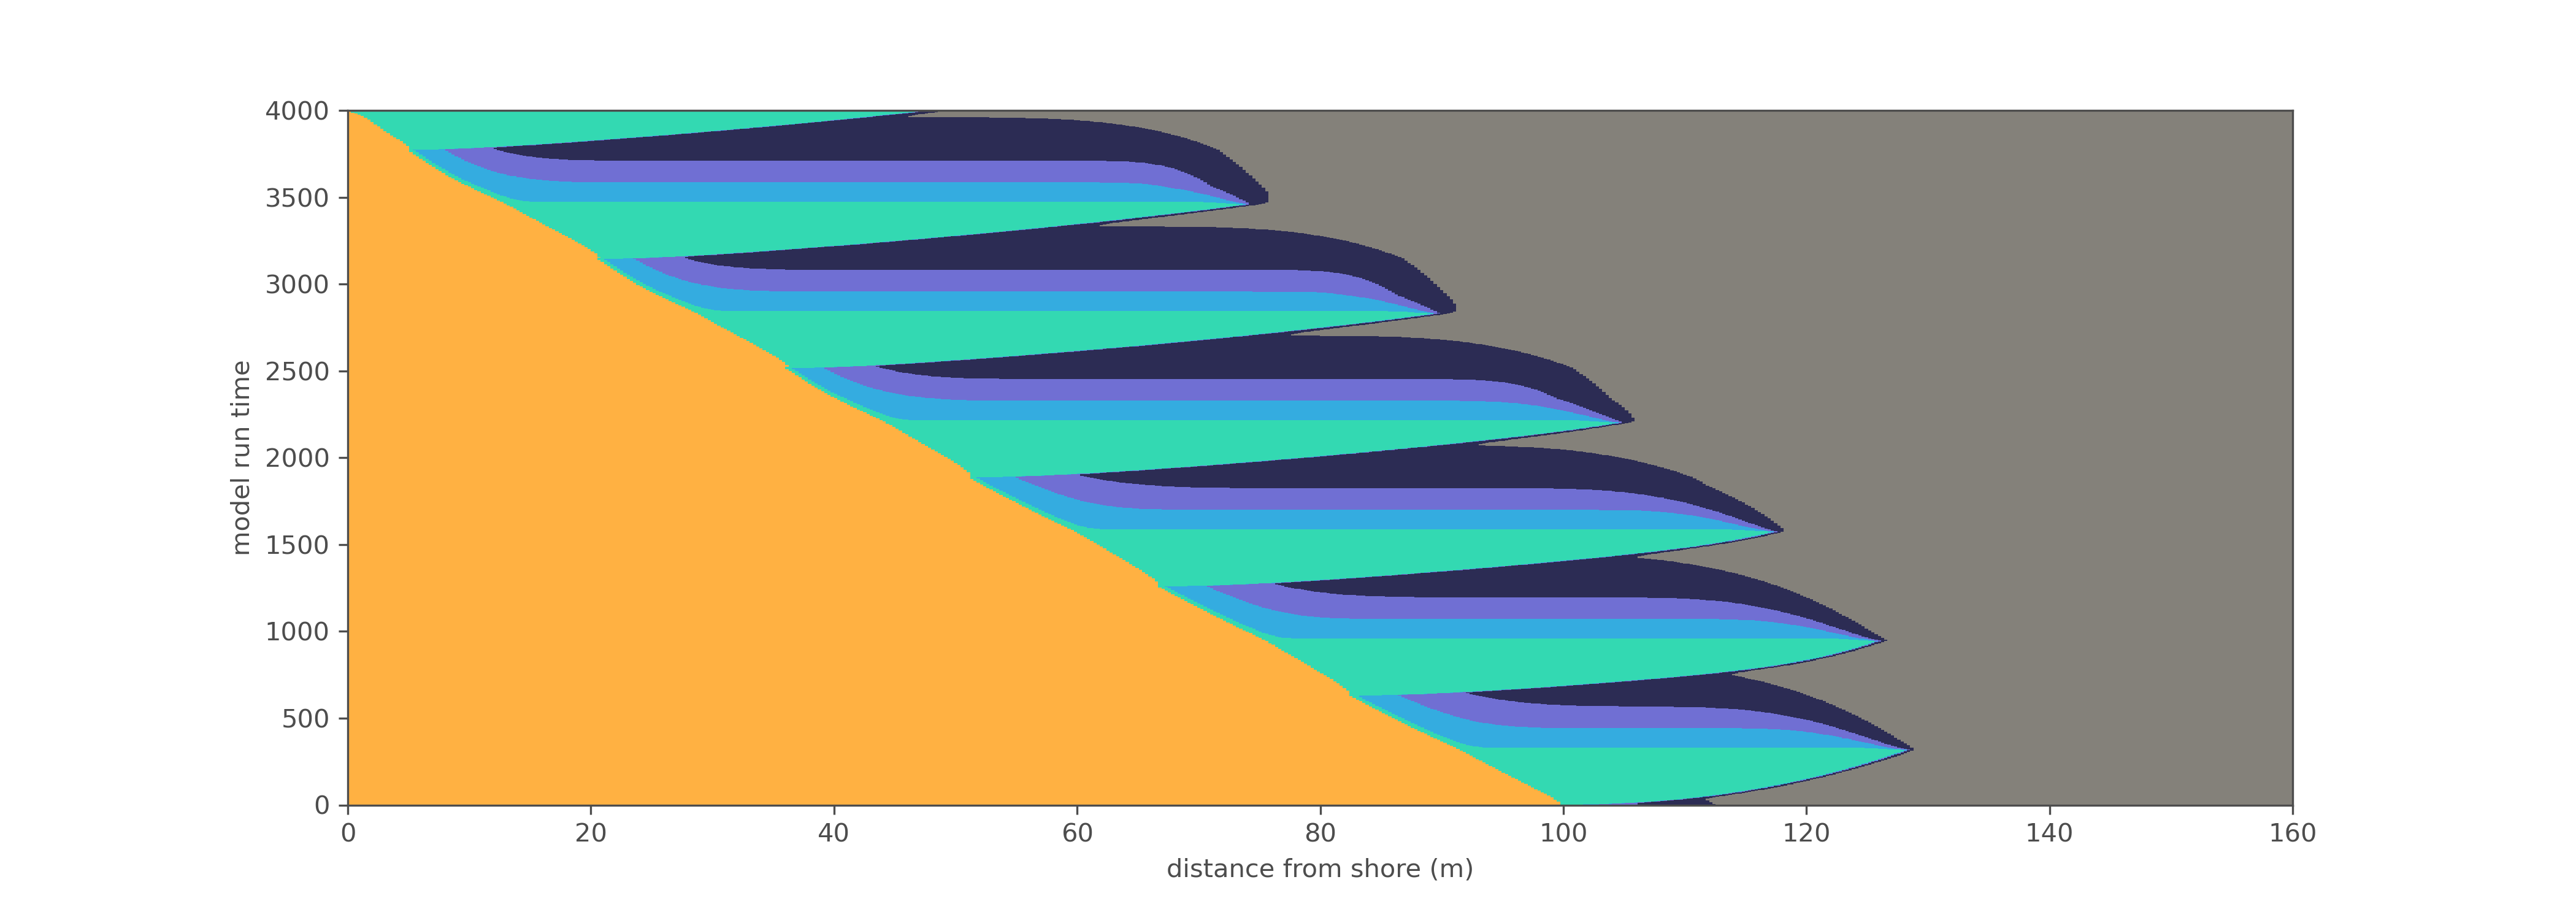
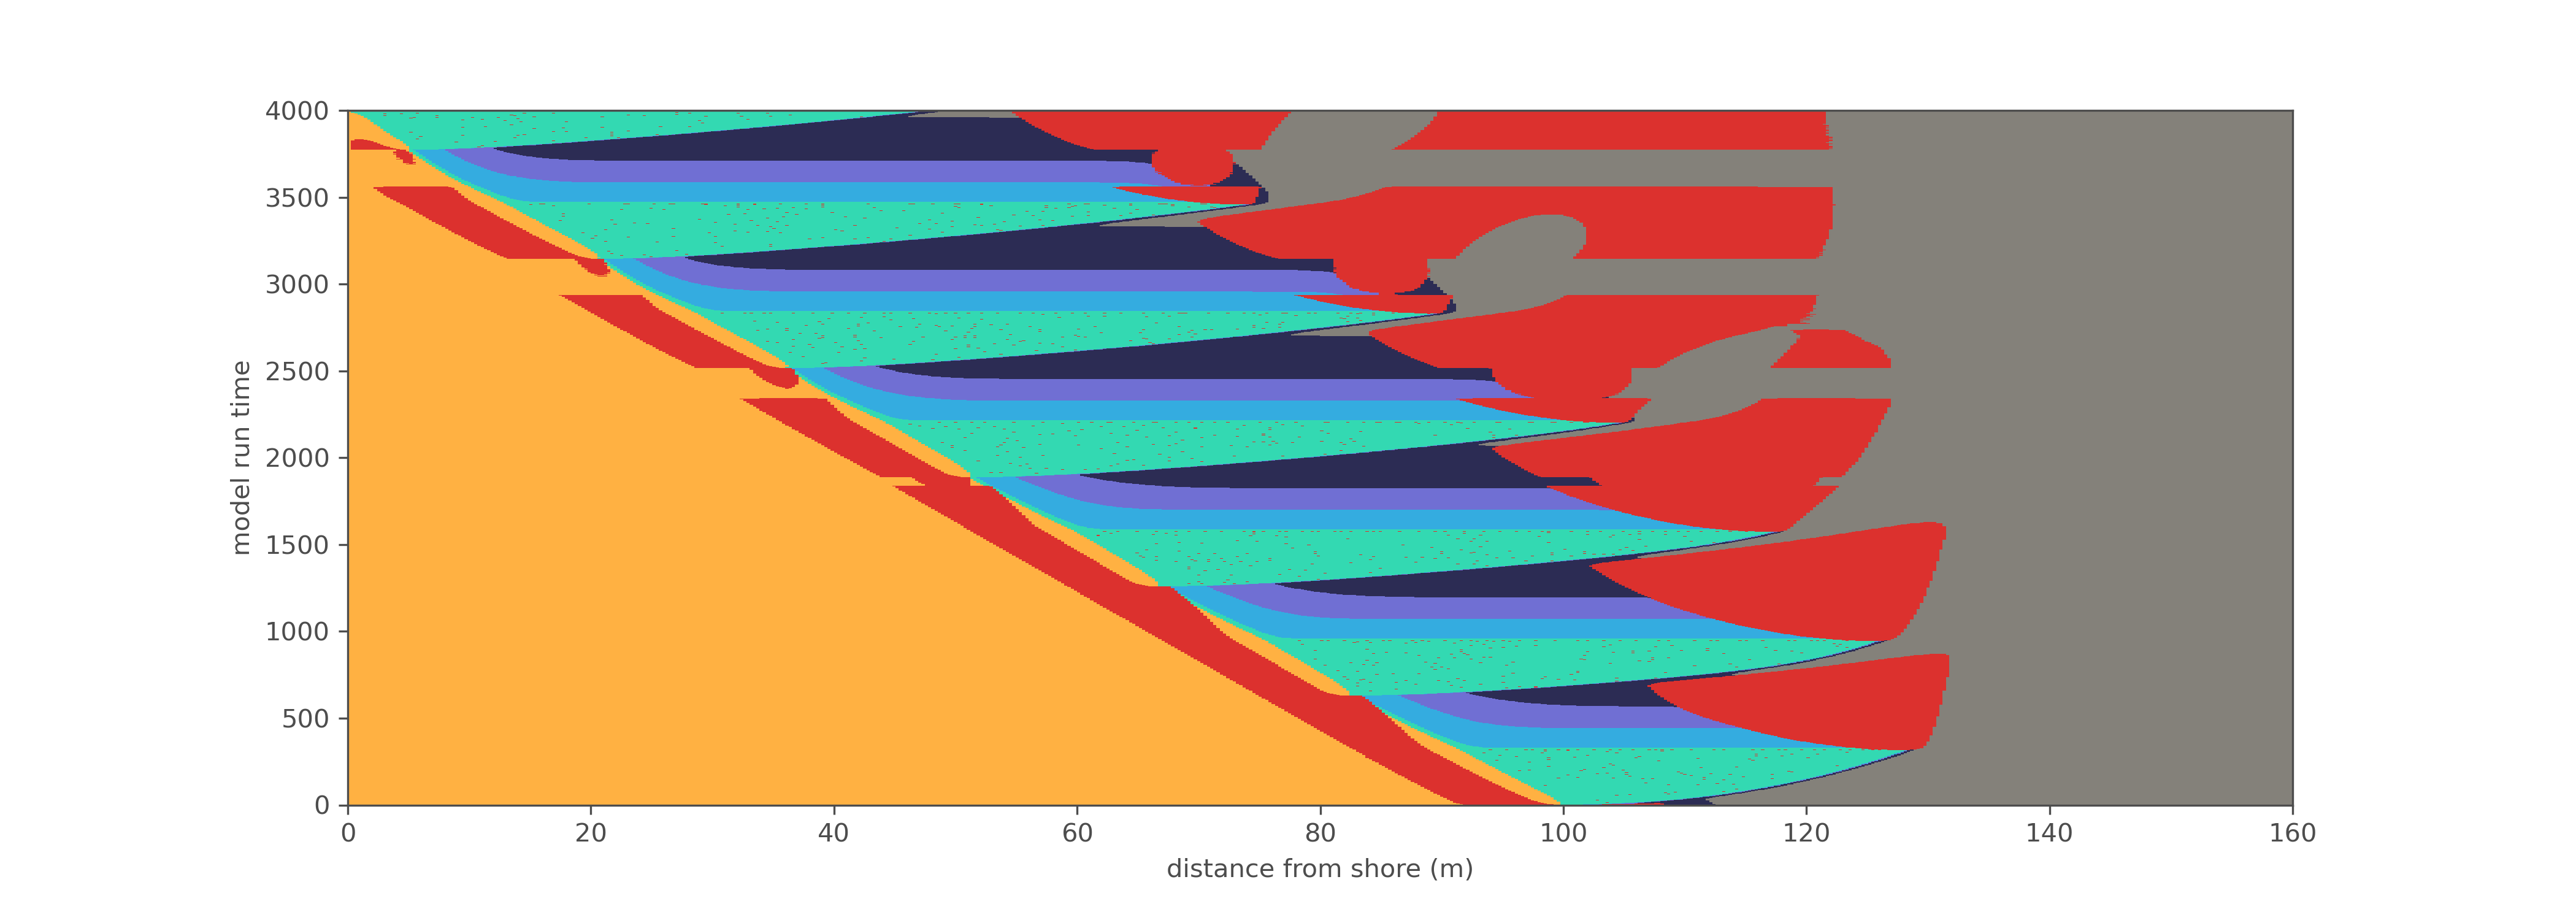
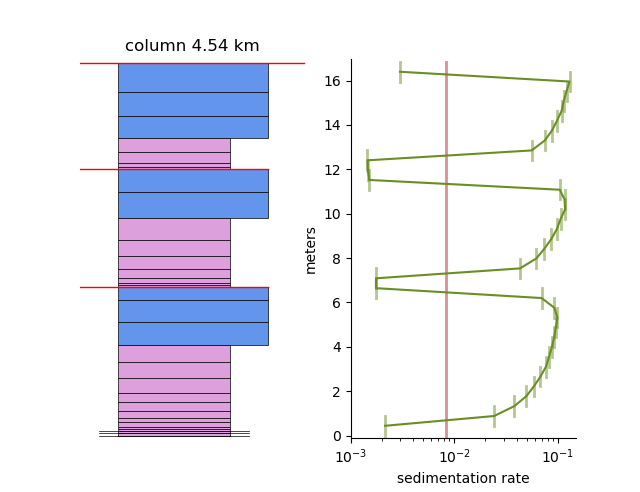
On/Off sediment supply with constant subsidence: Wheeler diagram
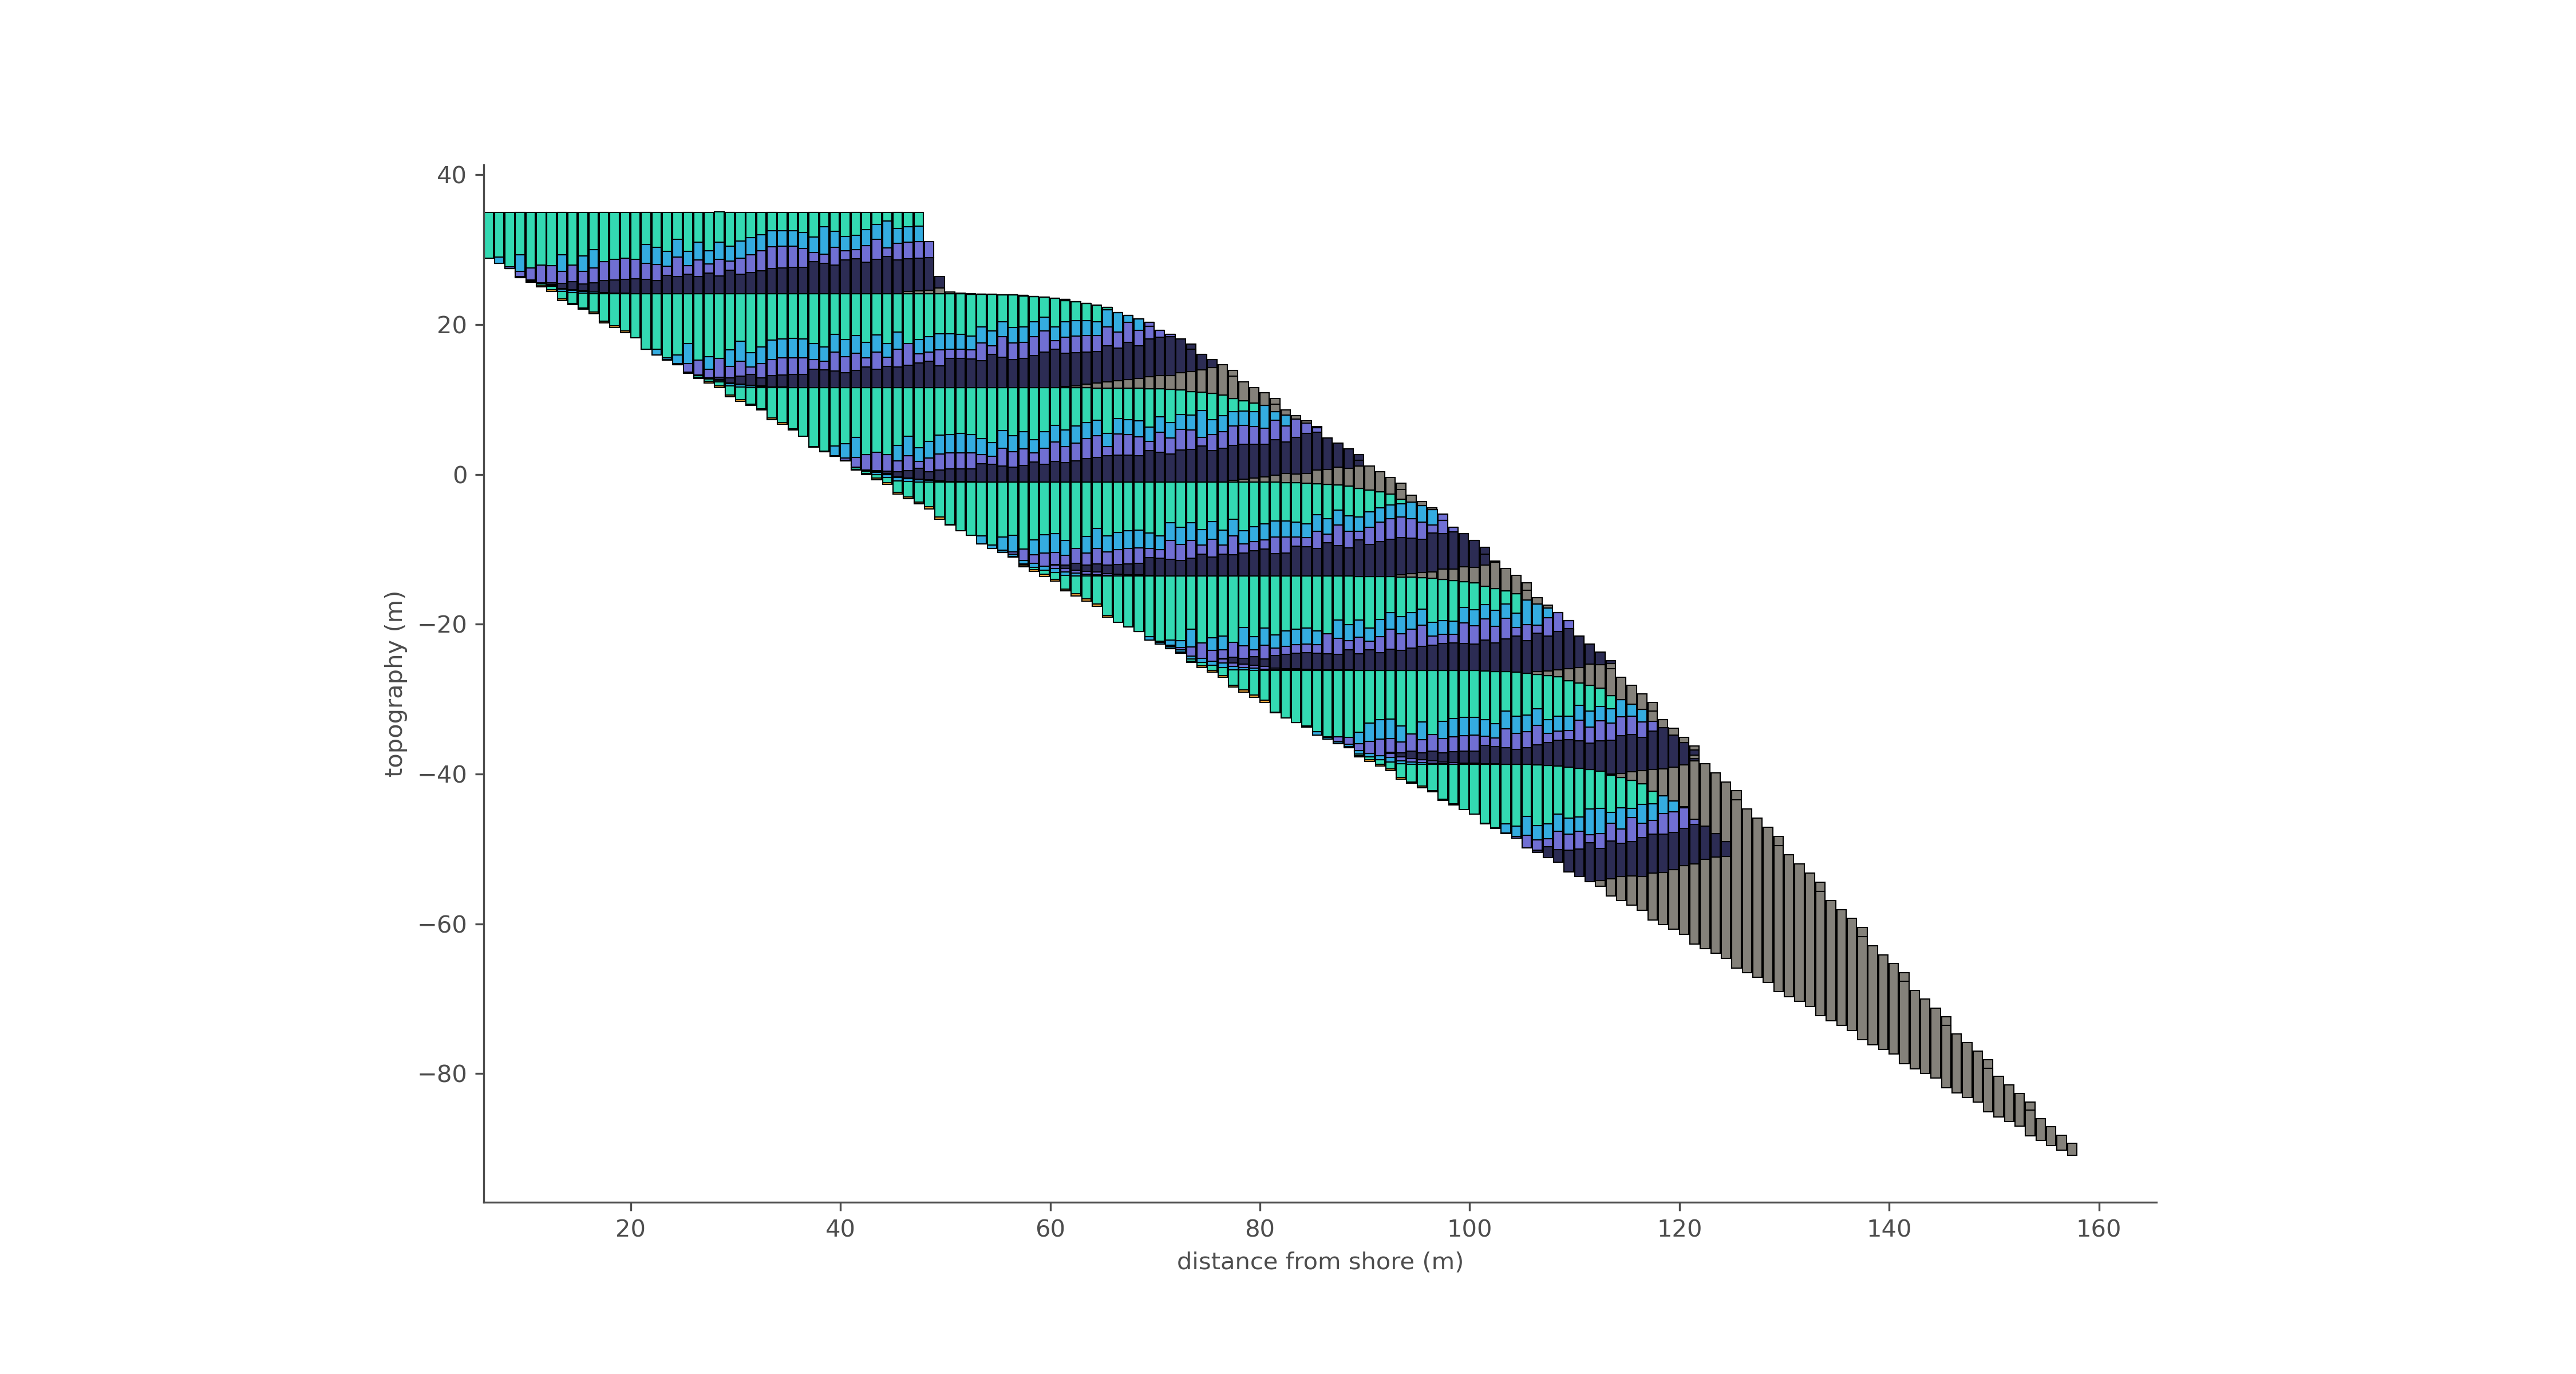
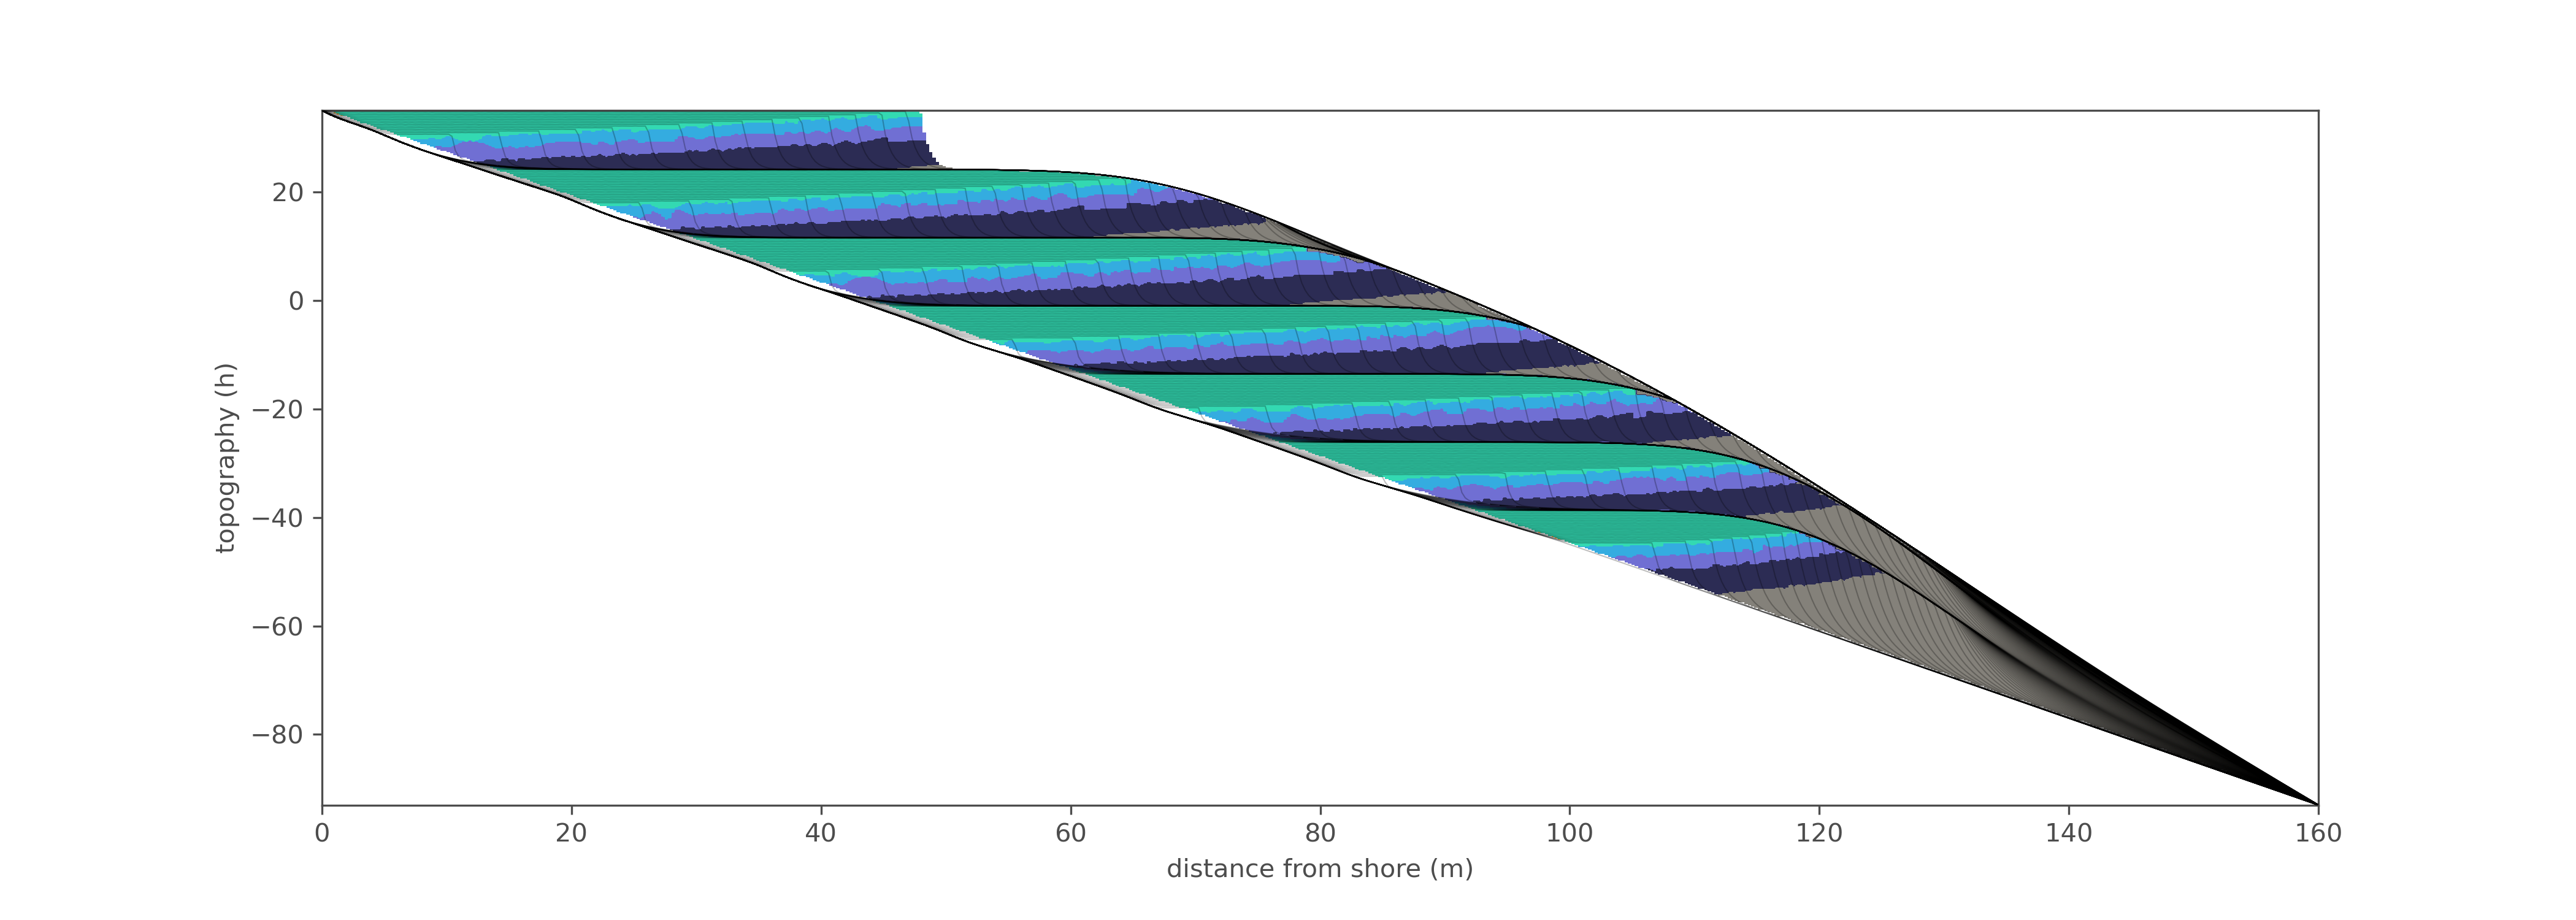
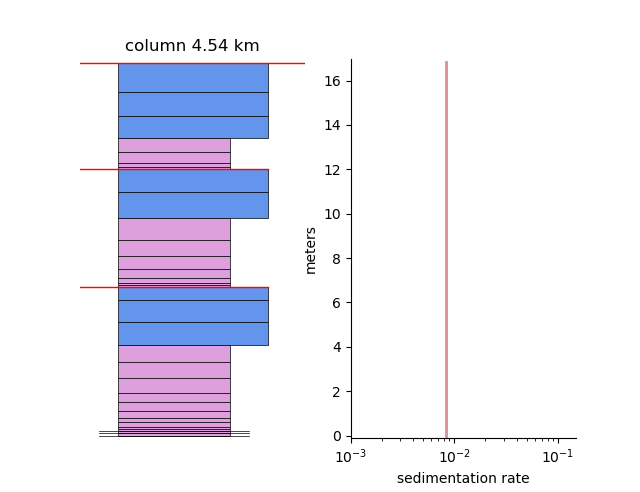
On/Off sediment supply with constant subsidence: stratigraphic profile
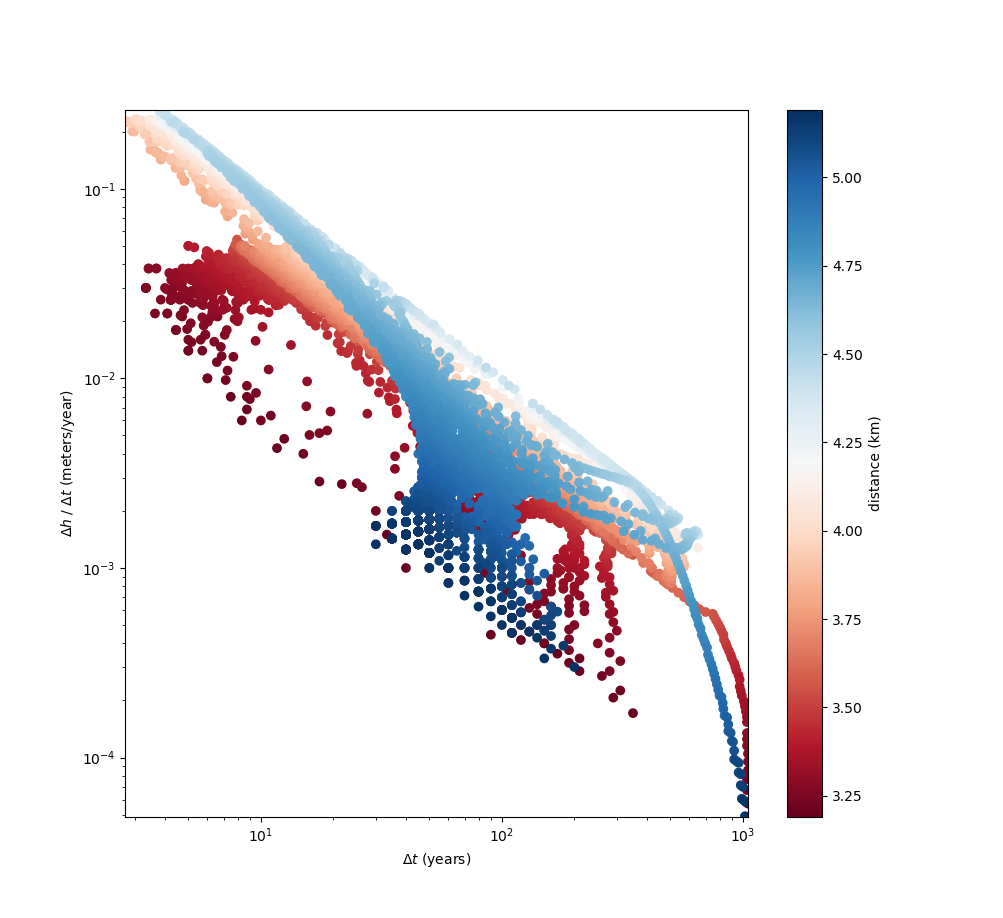
Time in the rock record
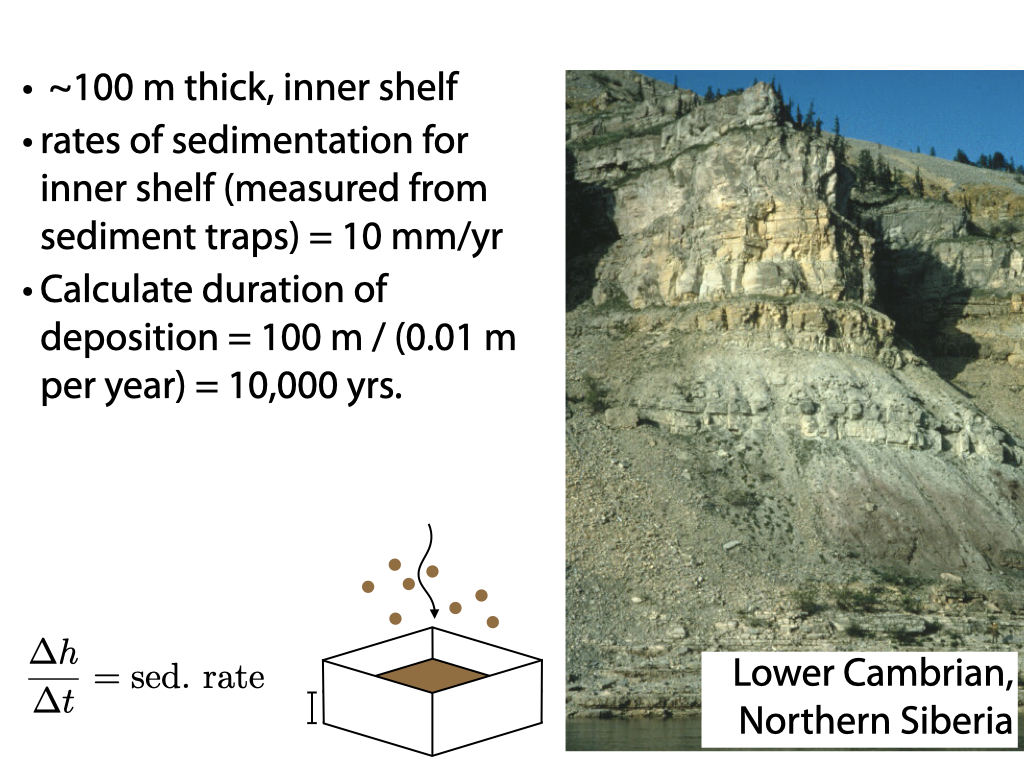
Time in the rock record
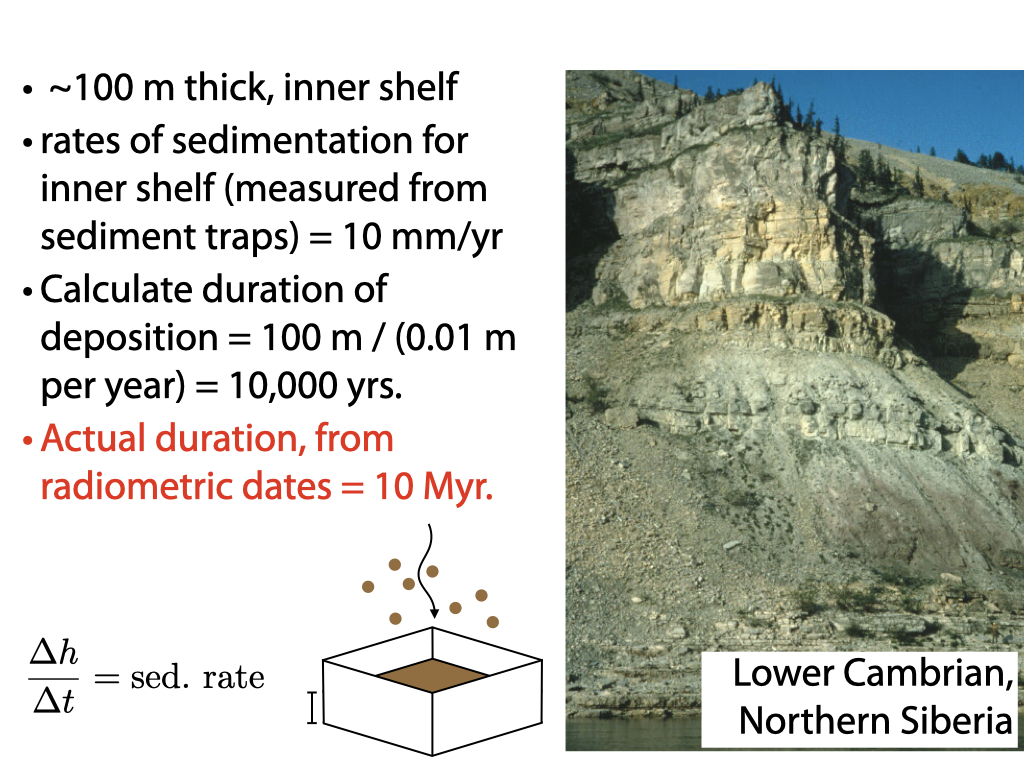
Time in the rock record
Time in the rock record
Time in the rock record
Why is this happening?
Time in our rock record
Why is this happening?
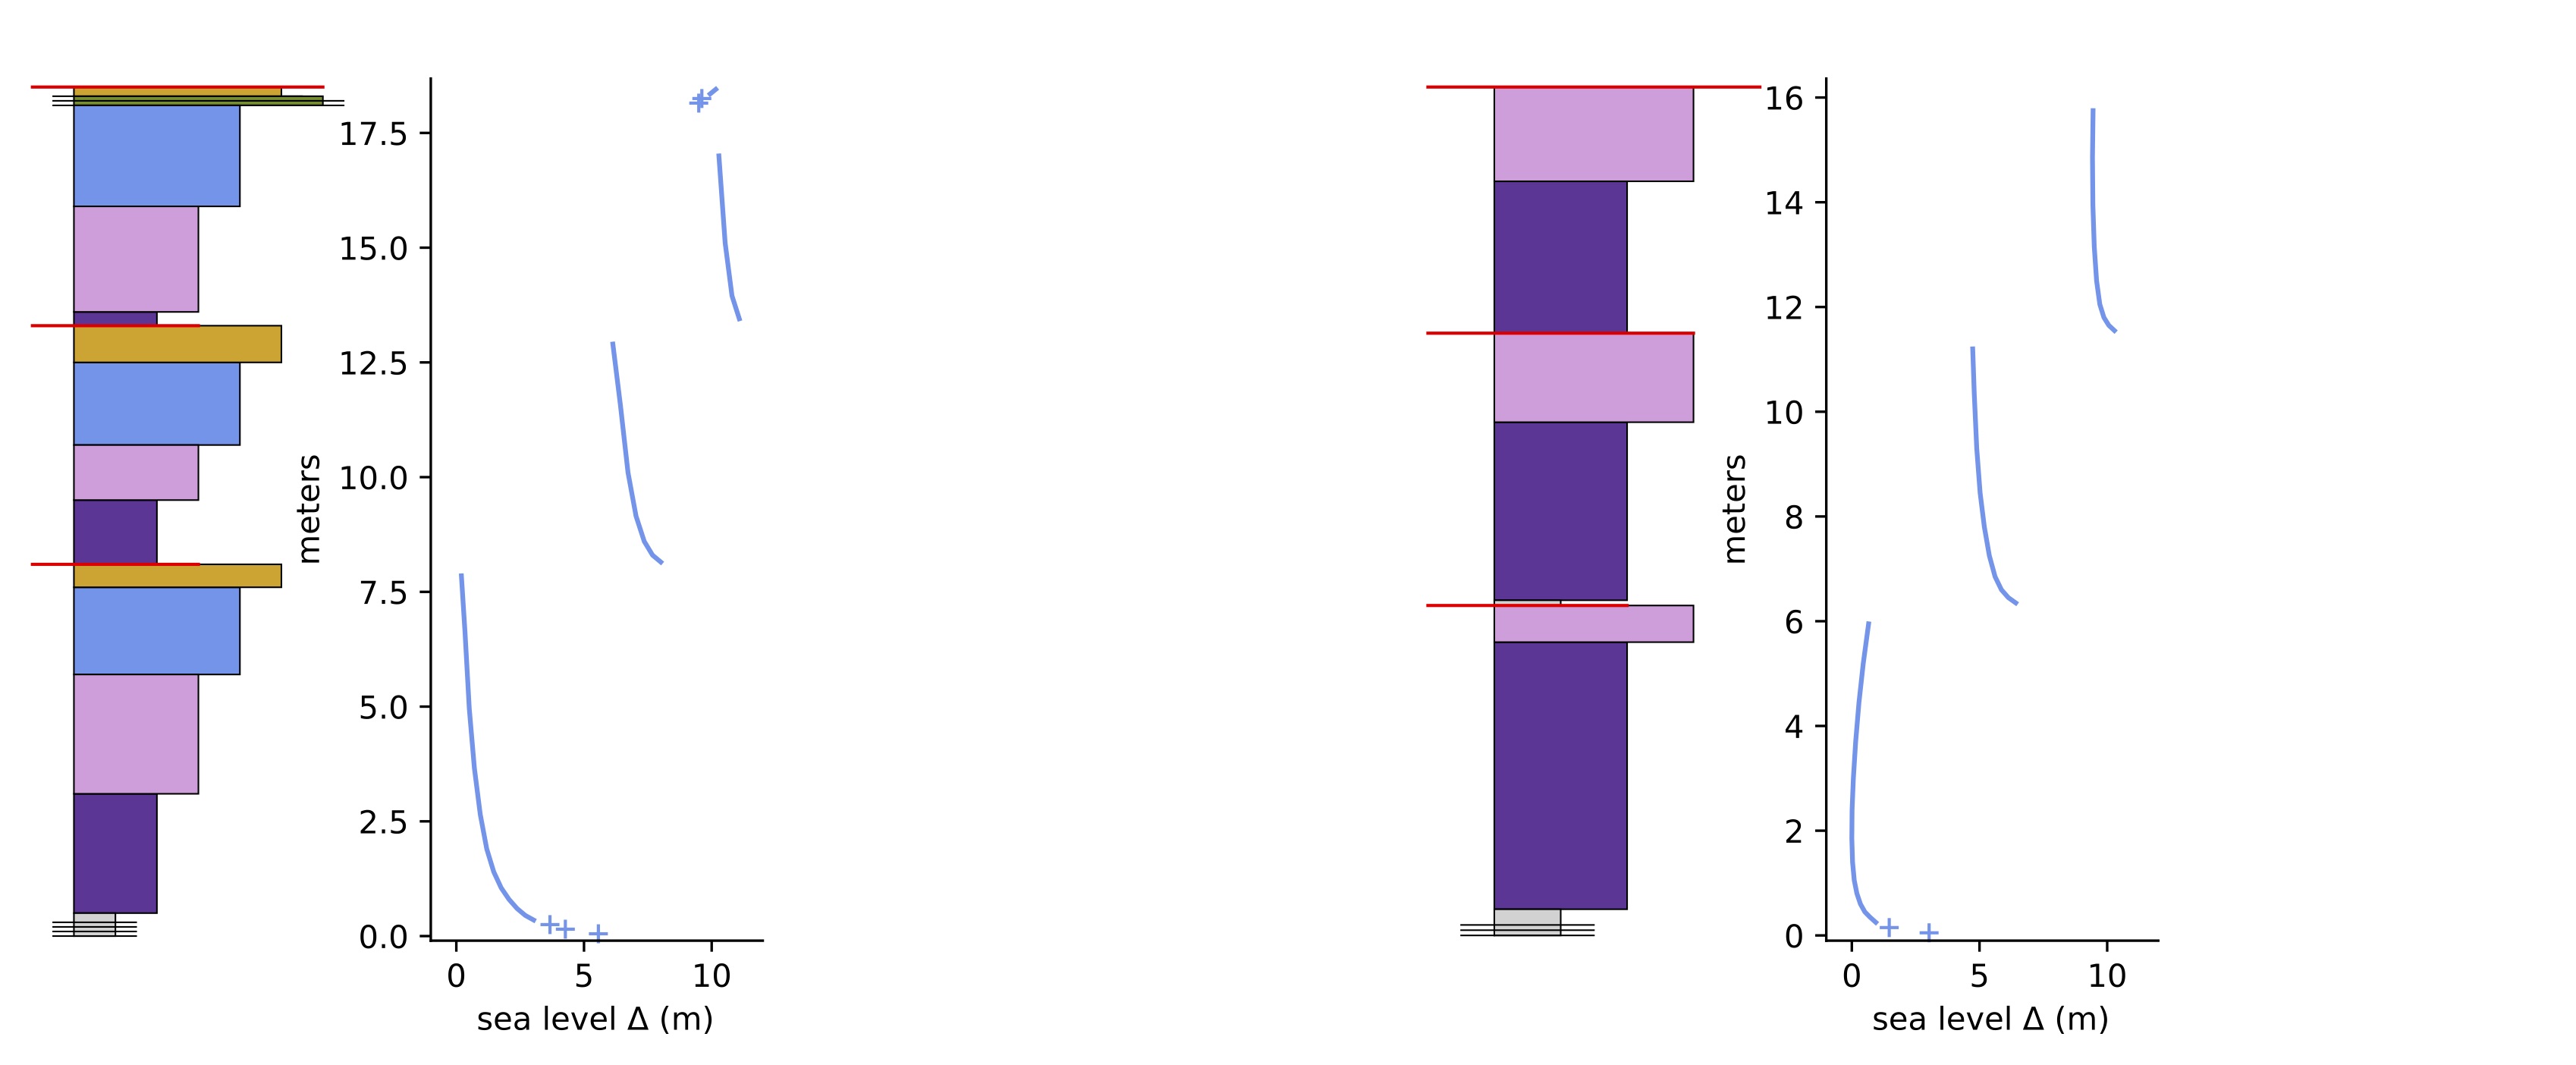
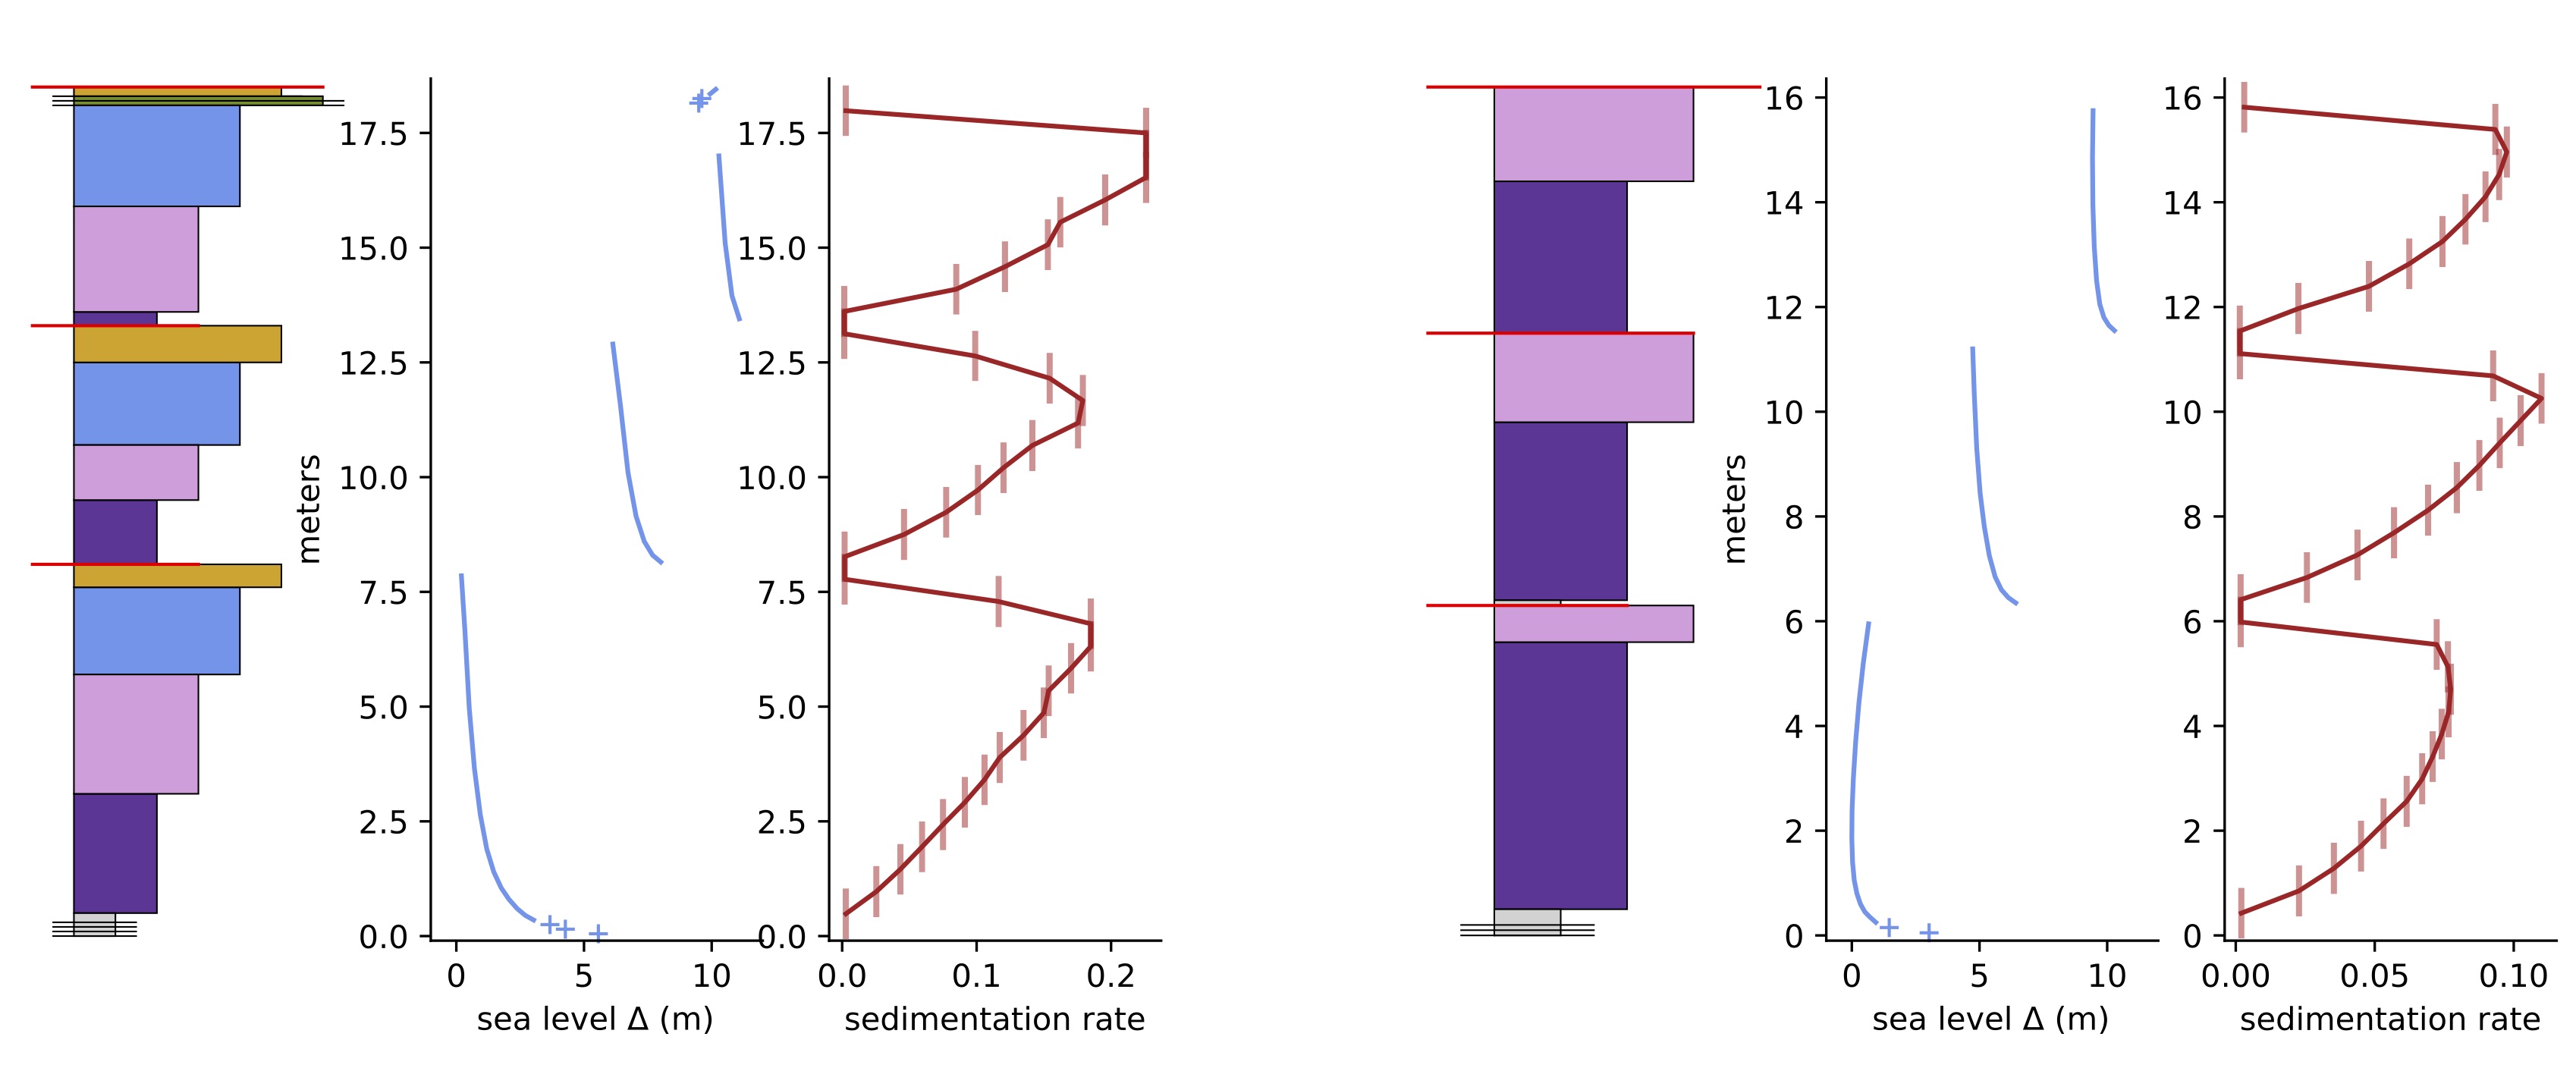
Correlating sequences: an example from our model
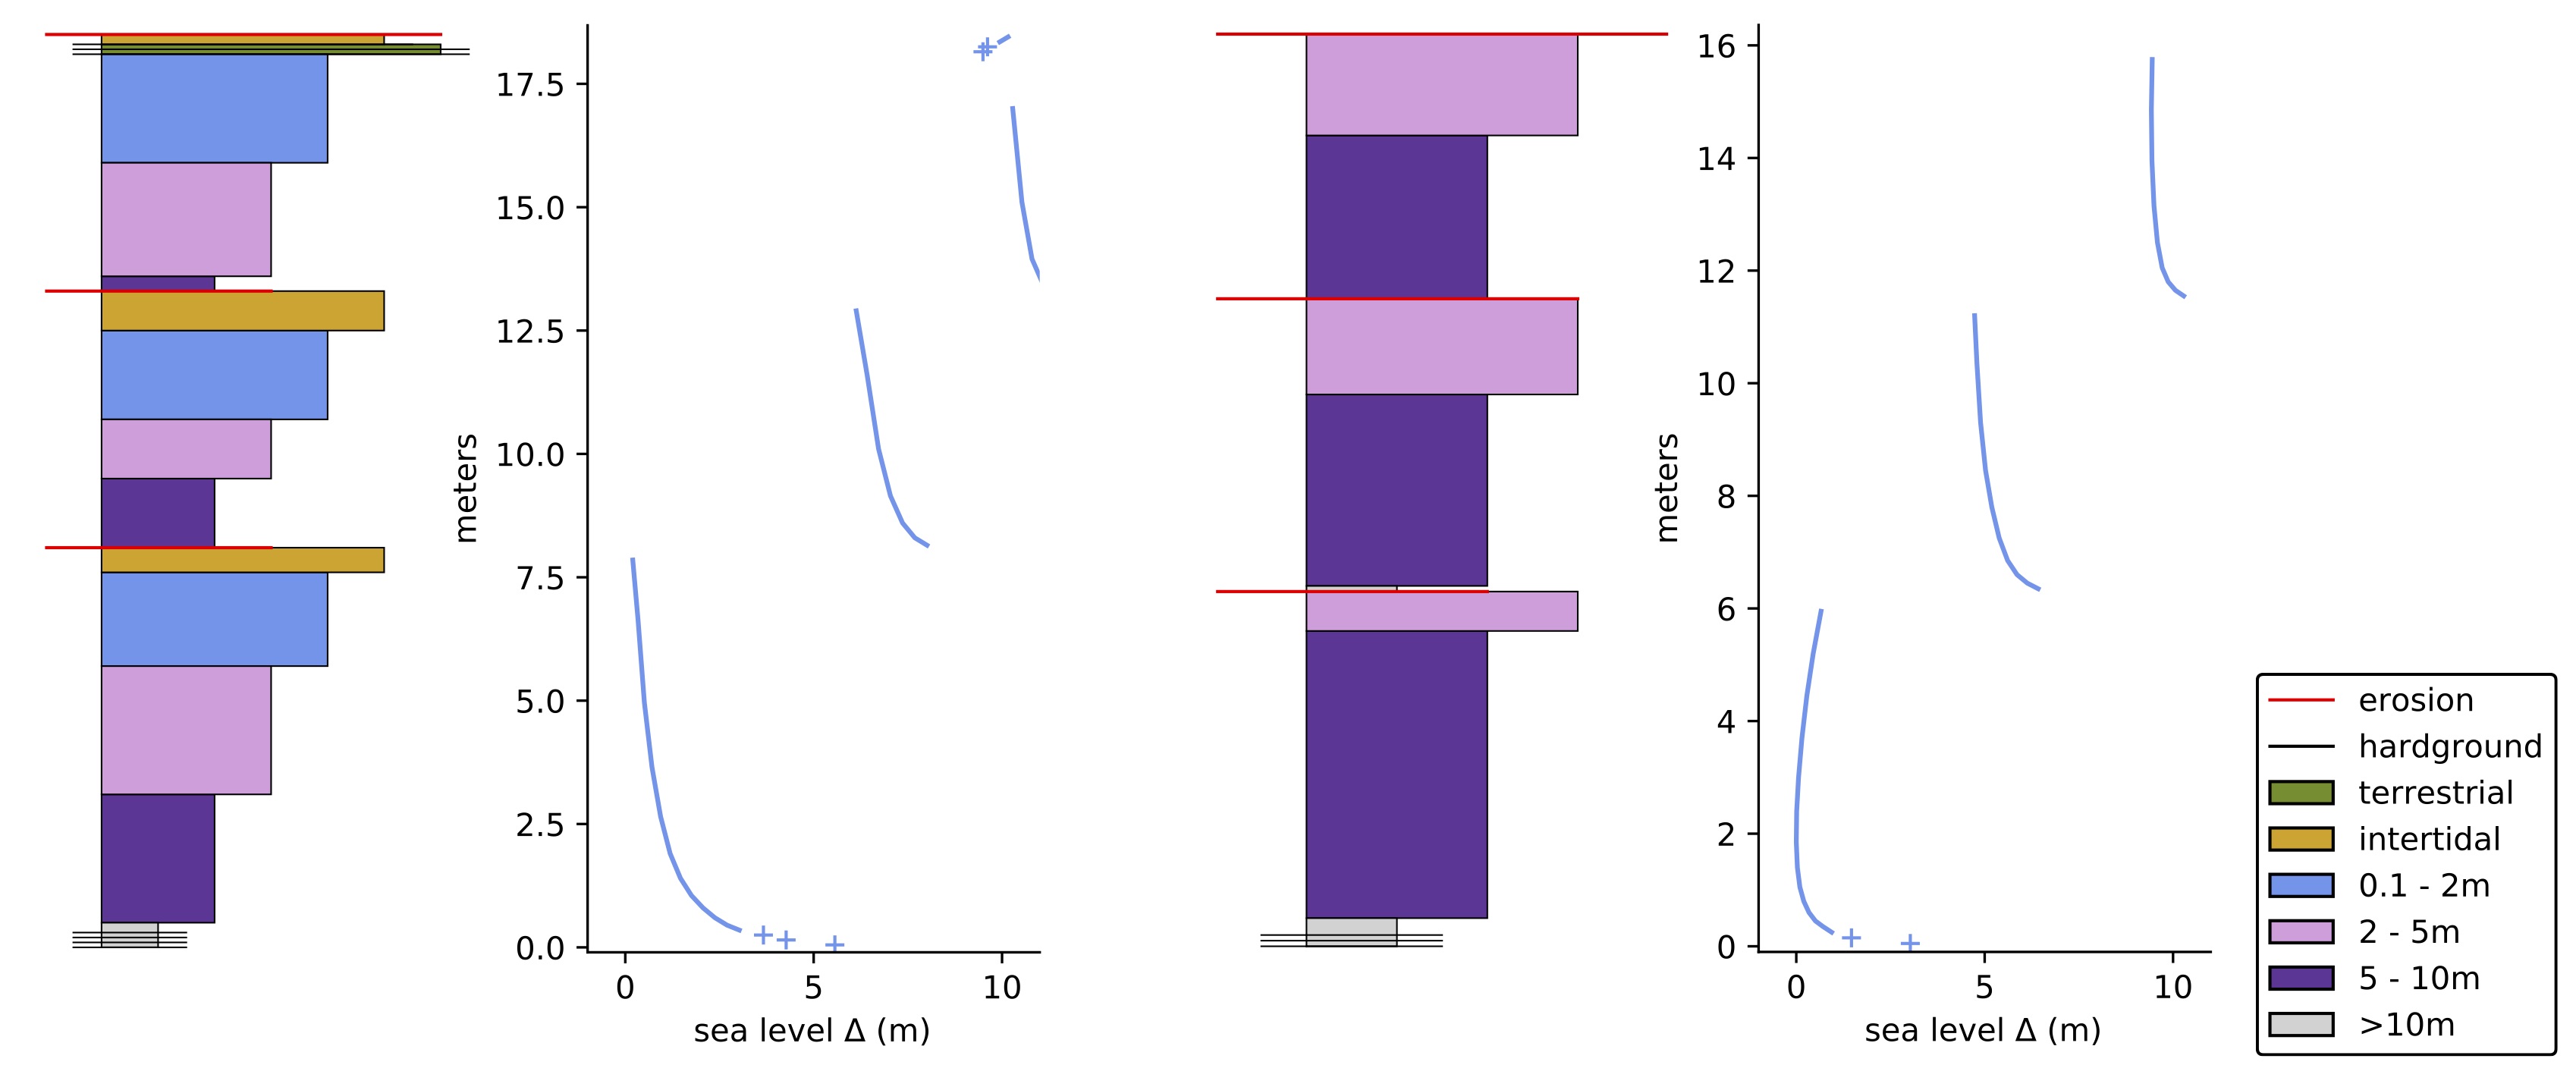
Correlating sequences: an example from our model
Correlating sequences: an example from our model
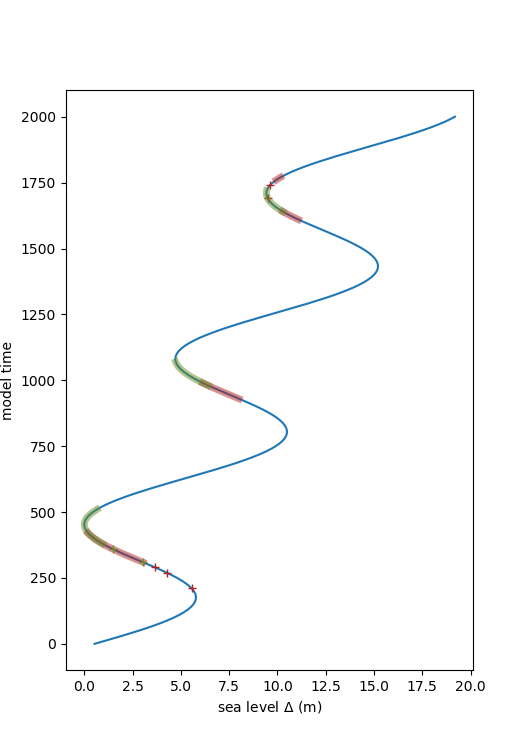
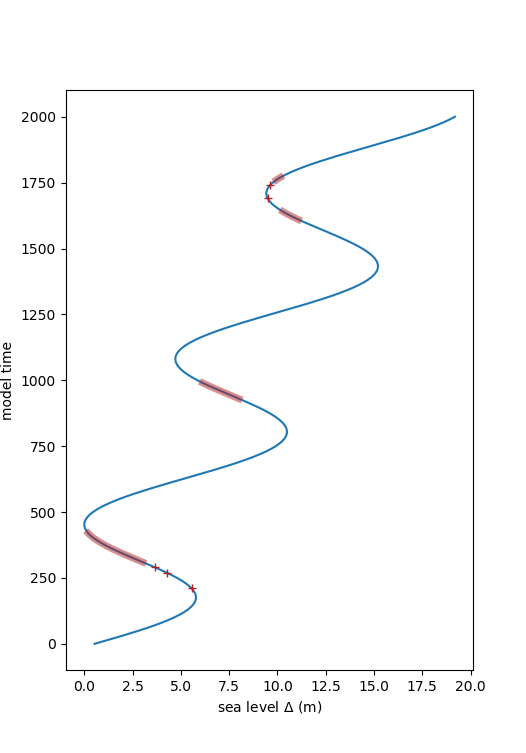
Why do the sea-level cycles look funny?
Why do the sea-level cycles look funny?
Correlating sequences
- an amazing key would be detecting this sea level signal
- how could this be done?
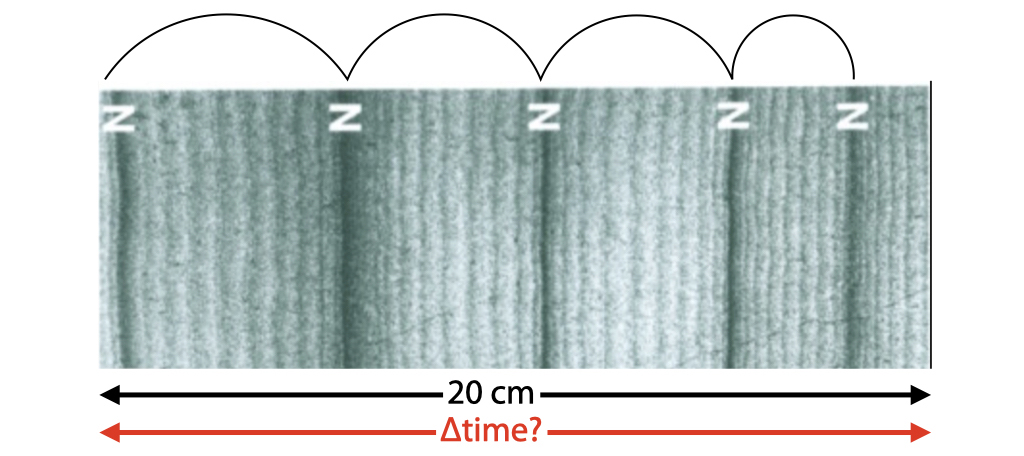
Cyclostratigraphy
- Cyclostratigraphy is a sub-discipline of stratigraphy that seeks to identify, characterize and interpret cyclic variations in the stratigraphic record
- identify cycles $\rightarrow$ interpret timing of cycles $\rightarrow$ age models and correlations
- fundamentally, it is about explaining the processes behind a record
Information can be described as an infinite series of sin and cos waves of differing frequencies and magnitudes.